


Key takeaways
- U.S. companies’ Days Inventory Outstanding (DIO) rose from 73 to 80 days between 2020 and 2024 — meaning cash sits in stock about a week longer than four years ago.[1]
- The annual carrying cost of inventory runs 20–30% of its value.[2] On $1M of inventory that’s $200K–$300K of cost per year — most of it invisible on a P&L line.
- About 12% of inventory is dead stock on average across multi-channel brands; up to 18% in retail/fashion.[3]
- Companies that deploy ERP report 91% improvement in inventory optimisation and 62% reduction in purchasing/inventory control costs.[4]
- In trading businesses, inventory is rarely a warehouse problem. It’s a procurement, visibility and governance problem that surfaces as a cash-flow problem months later.
Overview
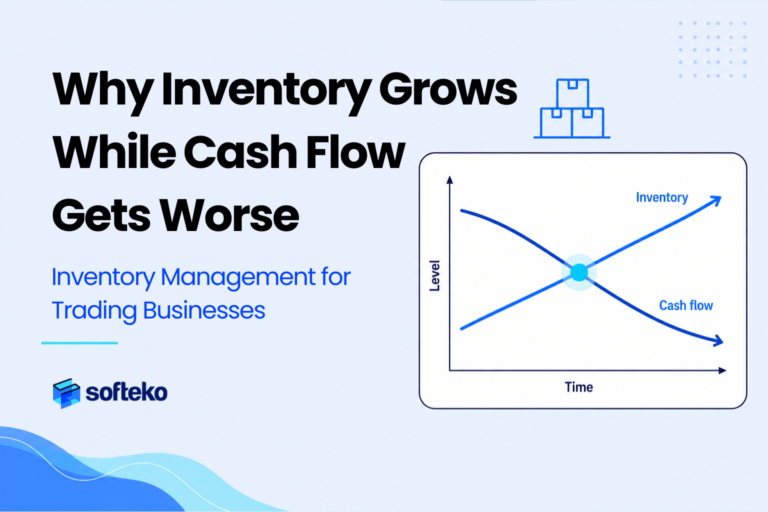
When inventory grows, many owners assume the business is growing. Often the opposite is happening: stock is rising, sales look healthy, but cash is harder to find every month.
The warehouse is full. Purchase orders keep going out. Suppliers are being paid. Yet finance keeps flagging working-capital pressure. At the same time, critical SKUs go out of stock while slow-movers sit untouched for months.
The root cause is almost never the warehouse. It’s upstream — in procurement decisions, incomplete inventory visibility, weak replenishment rules, and the gap between departments. When procurement can’t see reserved stock, incoming shipments, aging stock, or working-capital exposure, buying becomes reactive. Decisions get made on urgency, supplier promotions and habit instead of demand.
In this article:
- Why inventory management is harder in trading than manufacturing
- Why inventory grows even when demand is flat
- The hidden financial cost of overstocking (with carrying-cost math)
- How procurement decisions create most inventory problems
- Industry benchmarks for turnover, DIO and accuracy
- The 7 operational controls that consistently work
- How Odoo turns those controls into the default path of work
Why Inventory Management Is Harder for Trading Companies Than Manufacturers
Manufacturers control their own production schedules. Trading businesses, distributors, importers and wholesalers don’t — they sit between supplier behaviour, customer behaviour, lead times, freight, warehouse capacity and working capital simultaneously. One purchasing mistake propagates across every department.
5 Reasons Trading Inventory Is Hard to Control
| Complication | Why it matters |
|---|---|
| Large SKU portfolios | Same product in bulk, jumbo bag, drum, retail pack — each behaves differently. Manual control breaks above ~200 active SKUs. |
| Multi-location stock | Main + regional warehouses + 3PL + transit + intercompany + consignment. Without a single view, duplicate purchasing is routine. |
| Supplier lead-time risk | 30–60 day ocean lead times + port congestion + customs delays push buyers to over-order “for safety”. |
| Demand volatility | Customer projects slip, competitive pricing shifts demand, historical forecasts age fast. |
| Distributed ownership | Sales sees availability, procurement sees suppliers, warehouse sees fulfilment, finance sees cash. No one owns the full lifecycle. |
That last point is the one most businesses miss. Inventory effectiveness is not a department — it’s a cross-functional control system that connects demand → purchasing → stock → cash.
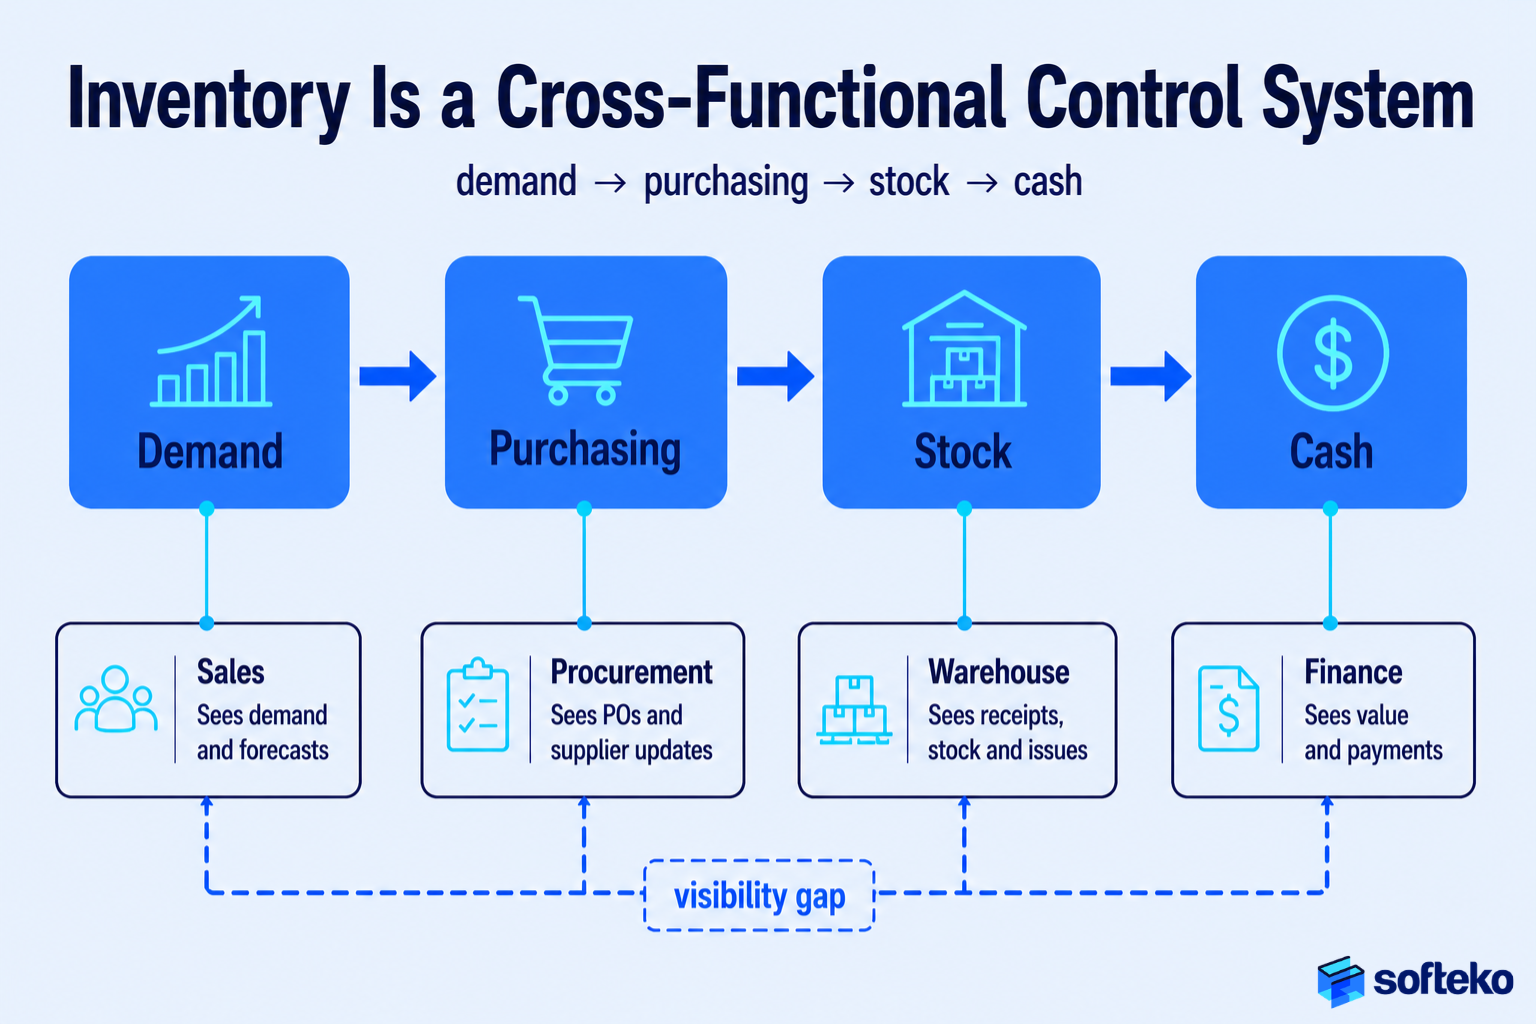
Real-time visibility shifts inventory work from reactive to proactive[5], but visibility alone is not enough — governance has to use it.
6 Reasons Trading Companies Lose Control of Inventory
Inventory problems rarely appear overnight. They build through hundreds of small purchasing decisions made with incomplete information. By the time the warehouse looks crowded, the financial damage is already months old.
| # | Root cause | Where it originates | Typical symptom |
|---|---|---|---|
| 1 | Incomplete visibility | Procurement can’t see reserved/incoming/intercompany stock | Duplicate purchases of the same SKU |
| 2 | Assumption-based purchasing | Buyer experience replaces data | Steady drift upward in stock levels |
| 3 | Procurement & inventory siloed | No shared workflow | Bulk deals approved with no inventory check |
| 4 | Supplier-discount buying | Procurement incentivised on price | Carrying cost > savings within 60 days |
| 5 | No stock-aging monitoring | Reports show quantity, not age | Slow-movers hide inside healthy totals |
| 6 | Weak / missing reorder rules | Replenishment by individual judgement | Overstock and stockouts simultaneously |
A widely cited academic study quantified this directly: a 1-unit improvement in procurement performance produces a 0.74-unit improvement in inventory performance[6]. Procurement decisions shape inventory outcomes more than warehouse execution does.
The warehouse stores the inventory. Procurement creates it. Finance funds it. Management carries the risk. If only the warehouse is held accountable, the cycle never breaks.
Why Accurate Stock Counts Do Not Stop Overstocking
Many teams assume that if stock counts match the system, inventory is under control. They are two different problems.
| Question it answers | Metric | Status if good |
|---|---|---|
| Do we know what we have? | Inventory accuracy | Records = physical |
| Should we have it at all? | Inventory control | Quantity matches demand |
A distributor can hit 100% inventory accuracy while holding 20 months of stock for a product that sells 100 units a month. The accuracy is perfect; the control is poor.
Industry data shows manual operations average just 63% inventory accuracy; barcode-enabled environments reach >99%, RFID around 95%[7]. Accuracy is the foundation — but turnover, aging and carrying cost reveal whether you actually have the right inventory.
How Much Excess Inventory Costs Every Year
Stockouts hurt visibly. Overstocking hurts quietly. Cost accumulates across procurement, warehousing, finance and operations — which is why most P&Ls underestimate it.
Annual Cost Breakdown for $1M of Excess Inventory
| Cost component | % of inventory value | Notes |
|---|---|---|
| Cost of capital | 8–15% | Money trapped instead of earning return / paying debt |
| Storage & warehouse rent | 3–6% | Space, racking, utilities |
| Insurance & security | 1–3% | Stock-value-based premiums |
| Handling & labour | 2–5% | Putaway, moves, cycle counts |
| Obsolescence & shrinkage | 2–5% | Damage, expiry, theft, write-offs |
| Inventory financing | 2–4% | Working-capital lines used to fund stock |
| Total carrying cost | 20–30% | per R4.ai / Kearney research[2] |
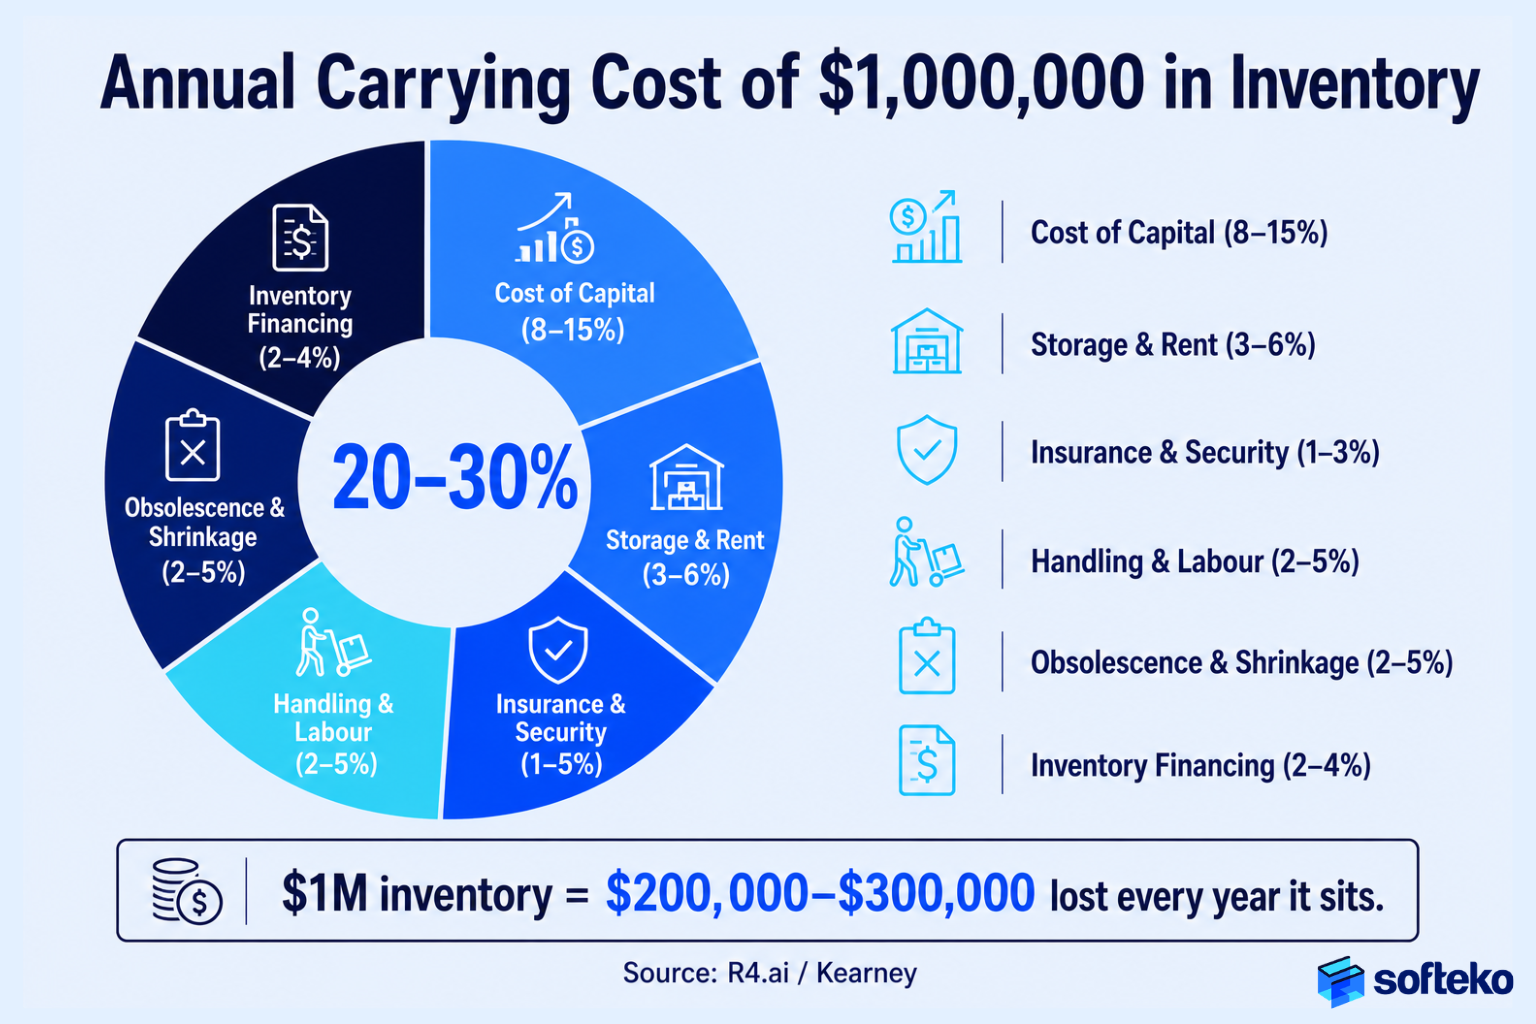
For $1M of inventory: $200,000–$300,000 of cost every year it sits. A 5% supplier discount that triggers six extra months of storage is a net loss.
On top of that, an average of 12% of inventory is dead stock, rising to 18% in retail / fashion[3] — not slow-moving, but unsellable. Dead stock is a 100% loss waiting to be recognised.
Inventory Turnover and DIO Benchmarks by Industry
If you don’t know what “good” looks like in your sector, you can’t tell whether your stock position is healthy or quietly draining cash. The two most important benchmarks are inventory turnover (how many times stock cycles per year) and DIO (how many days inventory sits before being sold).
Inventory turnover by industry (Q1 2024)
| Industry | Turnover (×/year) | Implication |
|---|---|---|
| Retail | 13.79 | Cash recycles ~every 26 days |
| Transportation | 9.05 | ~40 days |
| Technology | 7.82 | ~47 days |
| Healthcare | 3.0 | ~120 days |
| Capital Goods | 2.44 | ~150 days |
Source: Netstock / CSIMarket benchmarking, Q1 2024.[8]
Days Inventory Outstanding (DIO) by Industry (2024–25)
| Industry | DIO (days) | Working-capital implication |
|---|---|---|
| Food | ~6 | Cash recycles weekly |
| Retail | 30–40 | Healthy if turnover is high |
| Steel | ~50 | Cyclical exposure |
| Healthcare | ~120 | Heavy working-capital load |
| Pharmaceuticals | ~180 (rising) | Bullwhip + supply-security buffering |
Source: CSI Market, 2024–25.[9]
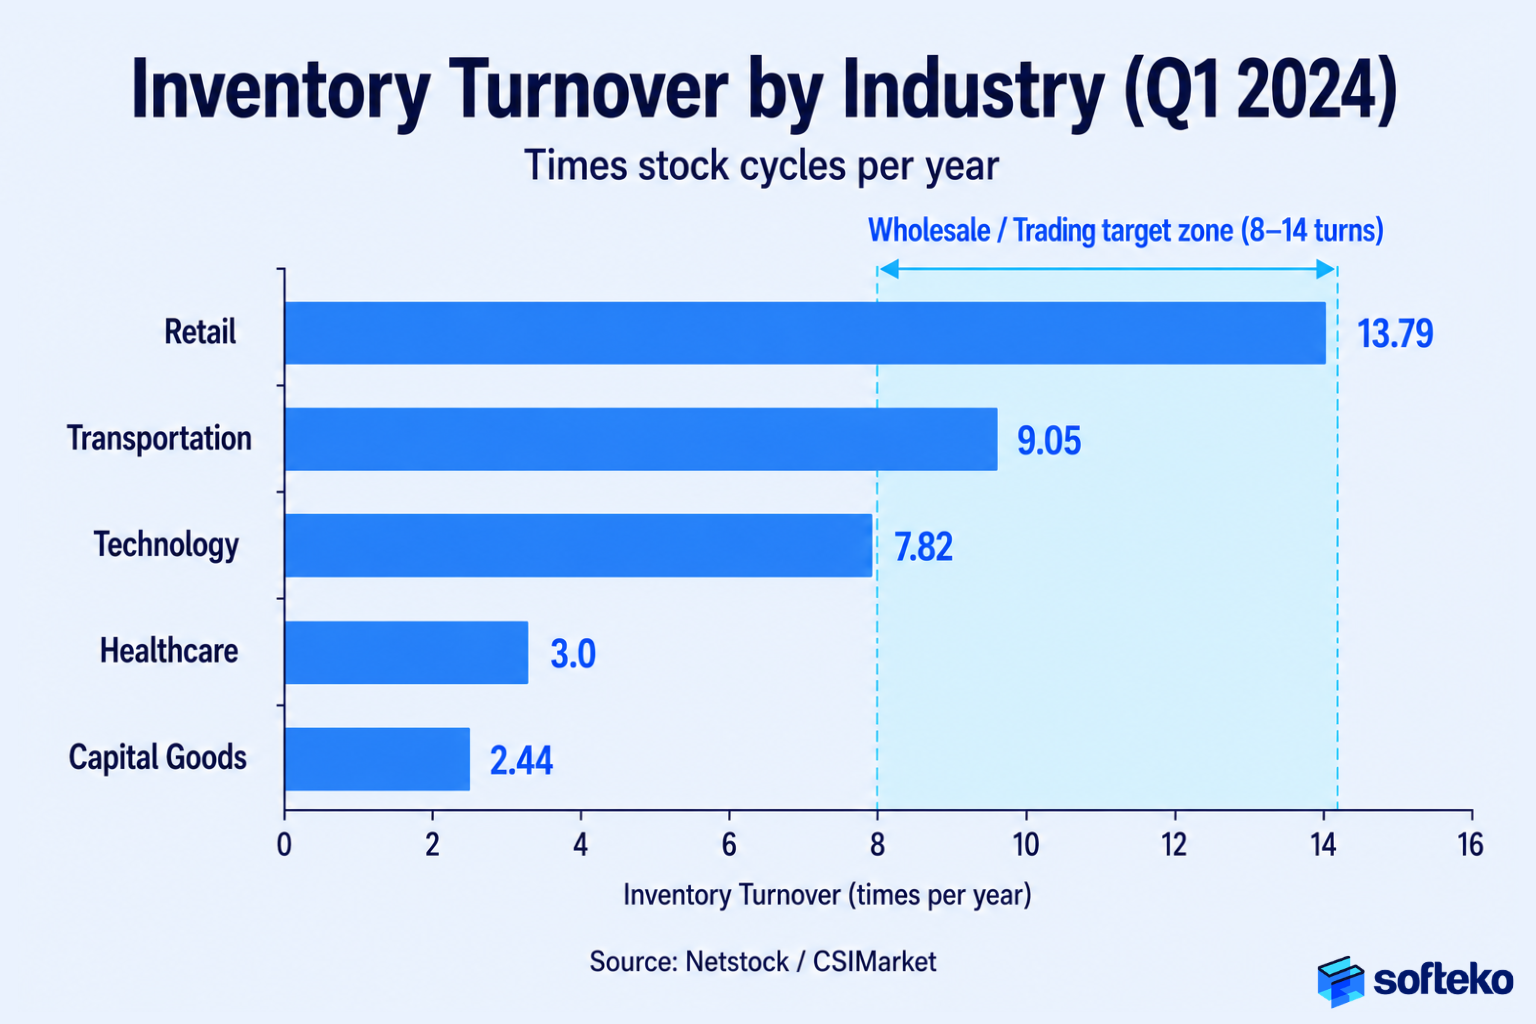
Wholesalers and trading businesses typically operate between Retail and Capital Goods — 8–14 turns is a defensible target range, though specific products vary widely. Anything below that range warrants a stock-aging review.
How inventory drains working capital
Inventory and cash flow aren’t separate issues. Inventory is cash, just temporarily converted into products.
The U.S. Working-Capital Trends (2020–2024)
| Year | Median Cash Conversion Cycle | DIO |
|---|---|---|
| 2020 | 83 days | 73 days |
| 2023 | 90 days | ~79 days |
| 2024 | 89 days | 80 days |
KPMG, 2025 — analysis of 2,700+ U.S. public companies.[1]
The pattern is clear: inventory is the largest and slowest-moving component of the CCC, and it has been getting worse since 2020. A separate Hackett Group / CFO.com survey of the 1,000 largest U.S. firms found their CCC improved 4% in 2024 — driven almost entirely by inventory and DPO improvements, not receivables.[10]
Why Smaller Trading Companies Need More Cash to Run Their Inventory
Smaller companies carry the heaviest inventory burden:
| Company size | Median CCC (2024) |
|---|---|
| Small (<$300M revenue) | 120 days |
| Mid ($300M–$3B) | 100 days |
| Large (>$3B) | 65 days |
Source: KPMG, 2025. [1]
A small or mid-sized trading business sits on cash inside inventory for nearly twice as long as a large enterprise. That’s the inventory-governance gap — and it’s the single biggest reason SME trading companies need stronger controls, not bigger warehouses.
8 Inventory KPIs Every Trading Business Should Track
Stock-quantity reports tell you how much. They don’t tell you how well. These eight KPIs give a multi-dimensional view:
| KPI | What it measures | What “good” looks like |
|---|---|---|
| Inventory turnover | Cycles per year | Match or beat industry benchmark above |
| Days Inventory Outstanding (DIO) | Avg days stock sits before sale | Trending down |
| Stock aging | % of stock in 0–30, 31–90, 91–180, 180+ day buckets | <10% in 180+ bucket |
| Fill rate | Demand satisfied from on-hand stock, first attempt | 95–98% |
| Service level | % orders fulfilled without shortage | 98%+ — but not by over-buying |
| Inventory carrying cost % | Annual cost ÷ inventory value | Below 25% |
| Dead-stock % | Stock with no realistic sales path | <5% (ideal); ≤12% (industry avg) |
| Inventory record accuracy | System count = physical count | >99% with barcode |
Looked at together, these tell you whether inventory is creating value or consuming it. Looked at individually, any one of them can mislead.
How procurement decisions create inventory problems
By the time a product enters the warehouse, the inventory risk already exists — the quantity is fixed, the cash is committed, the supplier is locked in. So inventory control has to start where decisions are made.
The 5 procurement patterns that create overstock
| Pattern | What it looks like | What it actually does |
|---|---|---|
| Supplier-discount buying | “Buy 200 more units and get 5% off” | Trades a one-time 5% saving for ongoing 20–30% annual carrying cost |
| Availability-only KPIs | Procurement measured purely on “no stockouts” | Encourages systematic over-buying |
| Stale forecasts | Plans built quarterly, never re-baselined | Buys to old demand pattern as market shifts |
| Missing reorder rules | Buyer judgement instead of min/max/ROP | Overstock + stockouts in parallel |
| Approvals based on cost, not inventory risk | “Is the supplier approved? Is the budget OK?” | Misses “do we already have it?” |
Fixing procurement metrics — adding inventory turnover, stock aging, dead-stock % and working-capital utilisation alongside price savings — is usually the single highest-leverage change a trading business can make to its inventory.
Inventory Controls That Keep Stock Aligned With Demand
High-performing trading businesses don’t run on heroic effort. They build controls into the workflow so inventory decisions are consistent regardless of who makes them.
| # | Control | What it prevents |
|---|---|---|
| 1 | Standardised replenishment rules (min, max, ROP, safety stock, lead time per SKU) | Subjective buying |
| 2 | Monthly stock-aging review (0–30 / 31–60 / 61–90 / 91–180 / 180+ buckets) | Dead-stock accumulation |
| 3 | Cross-functional purchase approvals above threshold | Bulk deals that destroy working capital |
| 4 | Demand-signal-driven procurement (sales orders, forecasts, consumption, not history) | Buying for last quarter’s market |
| 5 | Joint procurement-and-inventory KPIs (turnover, aging, dead stock + price savings) | Misaligned incentives |
| 6 | Multi-location stock visibility before any purchase order | Duplicate purchasing |
| 7 | Clear inventory ownership across the full lifecycle | “Not my department” outcomes |
These work manually up to a point. Above a few hundred active SKUs and more than one warehouse, they become impossible to enforce without a system that bakes them into the daily workflow.
How ERP Helps Teams Follow These 7 Controls
ERP doesn’t improve inventory because it’s software. It improves inventory because it removes the information fragmentation that breaks every one of the seven controls above.
| Without ERP | With integrated ERP |
|---|---|
| Procurement sees only its own warehouse | Procurement sees all stock + incoming + reserved |
| Sales commits without checking inventory | Inventory availability visible at SO creation |
| Approvals based on cost alone | Workflows include inventory + working-capital checks |
| Finance discovers overstock months later | Finance sees inventory exposure live |
| Reorder rules live in someone’s head | ROPs, min/max, safety stock applied automatically per SKU |
| Aging tracked in occasional spreadsheets | Aging buckets refresh in real time |
A 2025 industry study of companies running ERP for >1 year reports 91% achieved optimised inventory levels, 62% reduced purchasing/inventory control costs, and 74% experienced increased productivity.[4].
Importantly: visibility without governance only exposes problems — it doesn’t fix them. The ERP value comes from combining visibility with enforced workflow controls.
How Odoo Applies These 7 Controls For Trading Businesses
Odoo connects Inventory, Purchase, Sales and Accounting in one operational record. For trading businesses, the practical mapping looks like this:
| Operational control | Odoo capability | Module |
|---|---|---|
| Real-time multi-location visibility | Centralised stock view across warehouses, 3PLs, transit, intercompany | Inventory |
| Demand-driven replenishment | Reordering rules (min/max, ROP, lead time, route) per SKU per location | Inventory |
| Approval governance | Multi-step purchase approvals by value, supplier, product category | Purchase + Studio |
| Stock-aging monitoring | Stock valuation by date, aging reports, slow-mover detection | Inventory + Reporting |
| Inventory valuation linked to finance | Real-time WAC / FIFO / standard cost valuation feeding the GL | Inventory + Accounting |
| Cross-functional accountability | Shared records across Sales / Purchase / Inventory / Accounting | All four |
| Performance dashboards | Turnover, DIO, aging, dead stock, procurement spend | Reporting / Dashboards |
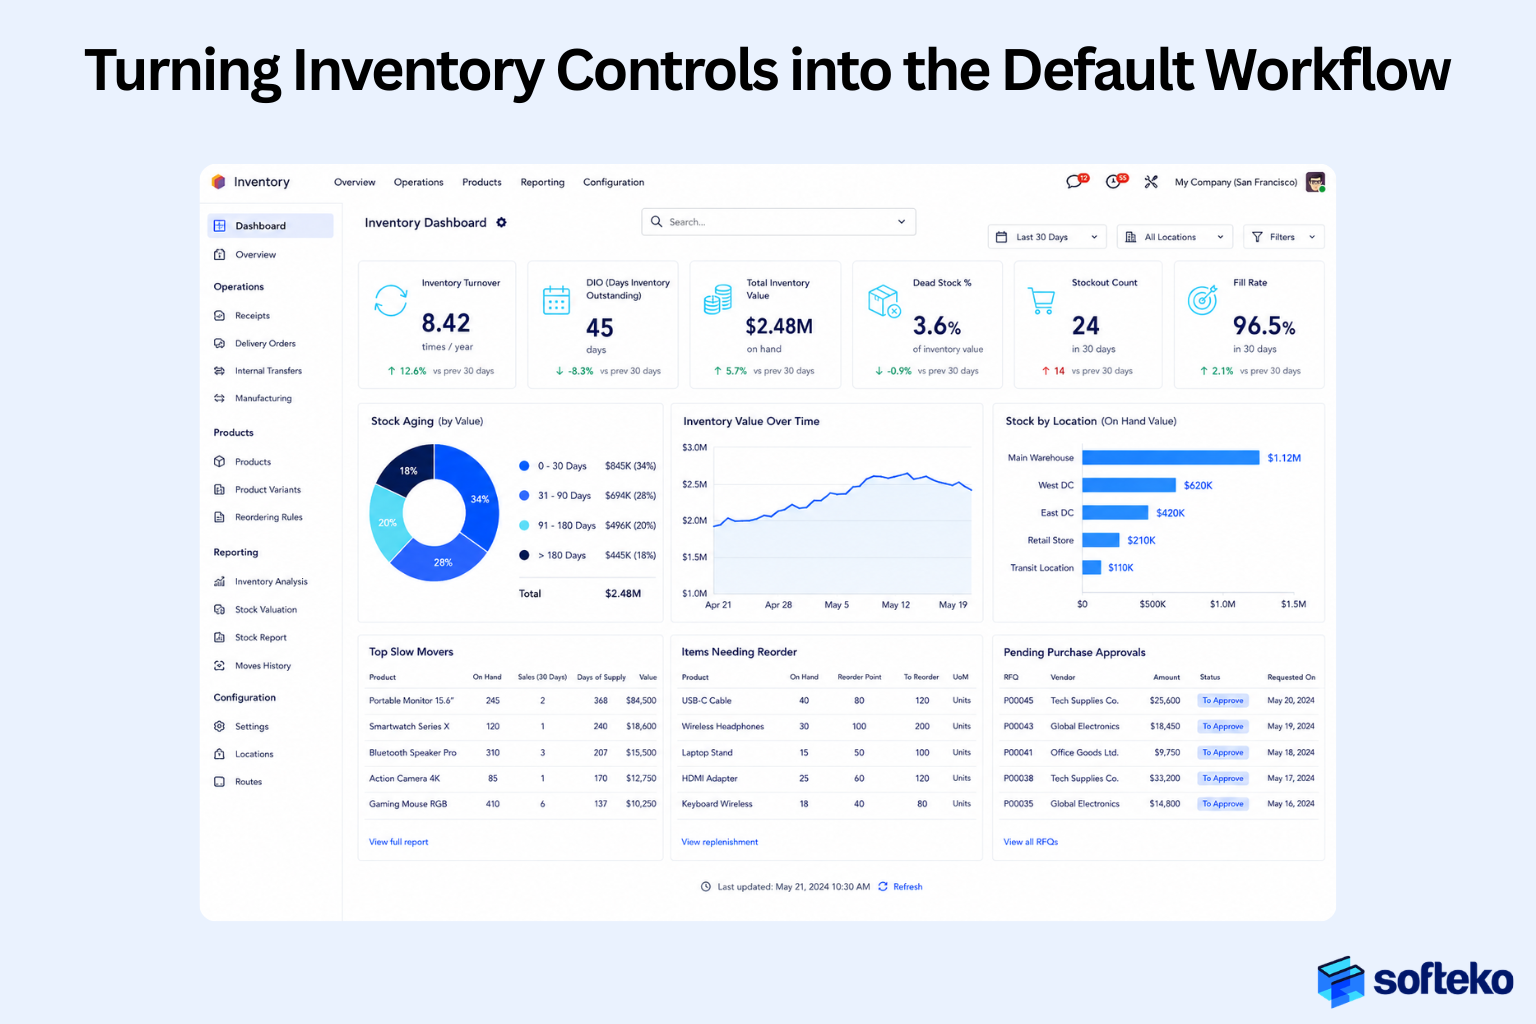
The point isn’t that Odoo replaces inventory management. It’s that Odoo makes the seven controls executable across hundreds or thousands of transactions without depending on individual memory.
5 Inventory ERP Implementation Mistakes
A few patterns repeat across trading-business ERP projects:
- Automating the broken process. Importing existing bad replenishment rules into Odoo doesn’t fix them — it scales them.
- Configuring the system before cleaning master data. A reorder rule on a misclassified SKU is worse than no rule.
- Treating it as an IT project. Inventory governance is an operational discipline; the system just enforces it.
- Measuring go-live instead of outcomes. The real KPIs are turnover up, DIO down, dead-stock down, carrying cost down — not “we went live on time.”
- Skipping cross-functional training. Procurement, warehouse and finance all need to read the same screens for the controls to hold.
Fix Inventory Before It Becomes a Cash Flow Problem
If your stock keeps growing, your DIO keeps rising, or finance keeps flagging working-capital pressure, the issue is rarely warehouse execution. It’s the absence of visibility and governance across the procurement → inventory → finance chain.
At Softeko, we help trading businesses analyse their inventory and procurement workflows, identify where working capital is leaking, and implement Odoo ERP as a practical control system for inventory, procurement and finance operations.
The goal isn’t to reduce inventory at all costs. It’s to hold the right inventory, in the right quantity, at the right time — and to free the cash that’s currently sitting on warehouse shelves.
FAQ
Why does inventory keep increasing even when sales are stable?
Because purchasing decisions are not aligned with current demand. Procurement often buys on historical patterns, supplier discounts, safety-stock assumptions, or incomplete visibility — so stock drifts upward even when sales are flat.
How does excess inventory affect cash flow?
Every product in the warehouse is cash that has left the business. The longer it sits, the longer cash is unavailable. KPMG’s 2025 data shows median U.S. DIO rose from 73 to 80 days between 2020 and 2024 — meaning cash is trapped a week longer than it used to be.
What’s the real cost of carrying inventory?
Industry research puts annual carrying cost at 20–30% of inventory value, covering capital, storage, insurance, handling, obsolescence and financing.
What inventory turnover should a trading business target?
8–14 turns/year is a defensible range for wholesale/trading, between retail (~13.8) and capital goods (~2.4) — per Netstock/CSIMarket benchmarks. Compare your industry’s median first.
How is inventory accuracy different from inventory control?
Accuracy = system records match physical stock. Control = you’re holding the right amount of stock. A business can be 100% accurate and still chronically overstocked.
What causes overstocking?
Most often: weak demand forecasting, supplier-discount-driven buying, missing reorder rules, duplicate purchasing across locations, and lack of stock-aging reviews. Procurement decisions create most of it before products ever reach the warehouse.
Why do businesses experience stockouts and overstocks at the same time?
Inventory allocation, not inventory total, is the problem. Some SKUs are over-purchased while others are under-purchased, usually because reorder rules don’t exist or aren’t enforced.
Which Odoo modules support inventory management for trading?
Inventory, Purchase, Accounting and Reporting work together. Inventory carries the stock + replenishment logic, Purchase carries approvals + supplier workflows, Accounting links inventory to working-capital reporting, and Reporting surfaces turnover, DIO, aging and dead stock.
References
- KPMG — Working Capital Trends in the U.S. Market, 2025 (DIO 73→80 days; U.S. CCC 2020–24; CCC-by-company-size) — https://kpmg.com/us/en/articles/2025/working-capital-trends-us-market.html
- R4.ai / Kearney — Inventory Carrying Cost Reduction (20–30% annual carrying cost benchmark) — https://r4.ai/inventory-carrying-cost-reduction/
- Kaizntree — Dead Stock Accounts for 12% of Total Inventory (12–18% dead-stock benchmark) — https://kaizntree.com/blog/dead-stock-accounts-for-12-of-total-inventory
- Jacopo — ERP Statistics 2025 (91% inventory optimisation, 62% cost reduction, 74% productivity gain) — https://jacopo.ee/en/resources/erp-statistics/
- Circana — The Importance of Near Real-Time On-Shelf Visibility — https://www.circana.com/post/the-importance-of-near-real-time-on-shelf-visibility
- Pizzuti et al., MSC-LES / EMSS 2015 Conference Proceedings — procurement → inventory 0.74 correlation — http://www.msc-les.org/proceedings/emss/2015/EMSS2015_436.pdf
- WifiTalents — Inventory Management Statistics (63% manual / 99% barcode / 95% RFID accuracy) — https://wifitalents.com/inventory-management-statistics/
- Netstock / CSIMarket — Benchmark Inventory Turnover by Industry — https://www.netstock.com/blog/benchmark-inventory-turnover-by-industry/
- CSI Market — Industry Efficiency Benchmarks (DIO by industry) — https://csimarket.com/Industry/industry_Efficiency.php?ind=1307
- Hackett Working Capital Survey via CFO.com — American Firms’ CCC Improved in 2024 — https://www.cfo.com/news/american-firms-cash-conversion-cycle-improved-in-2024-hackett-working-capital-survey/753285/