


Key takeaways
- The average inventory accuracy across businesses is just 83% — and only ~69% of companies even track it as a KPI.[1]
- Inventory accuracy is not a counting problem. It’s a visibility problem. The annual stock count just exposes errors that were created during receiving, put-away, transfers, picking and adjustments.
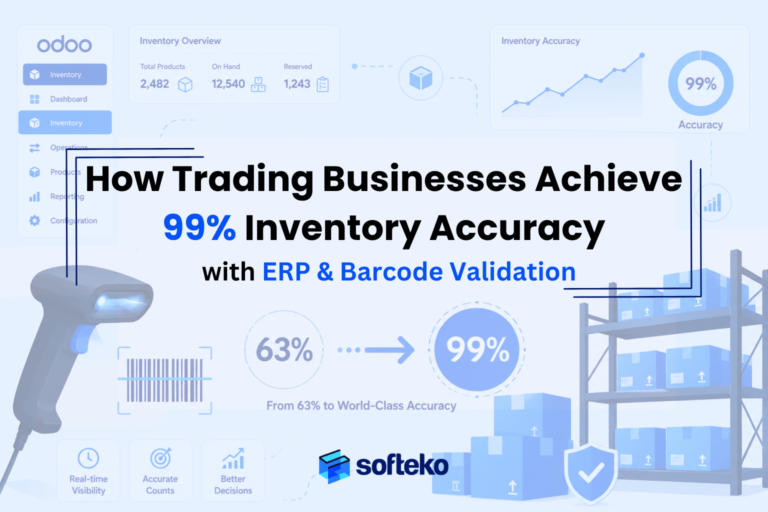
- Manual operations average around 63% inventory accuracy; barcode-validated workflows reach 98.5–99%.[2][3]
- Low-performing operations carry inventory at roughly 3× the carrying cost of top performers.[1]
- The fix isn’t more stock counts. It’s controlling every inventory movement — supported by an ERP that gives every department the same view of stock.
Overview
Inventory accuracy sounds like a warehouse metric. It isn’t. It affects sales commitments, purchasing decisions, working capital, customer service, and the credibility of every management report.
When system records don’t match physical stock, sales promises product that isn’t available. Procurement re-buys product that already exists somewhere. Warehouse staff burn hours looking for inventory the system says is there. And management makes decisions on numbers that can’t be trusted.
Most teams respond by scheduling more stock counts. The discrepancies always come back, because the cause isn’t counting — it’s hundreds of small, unrecorded inventory movements upstream. APQC’s logistics research is clear on this: inventory accuracy improves a wide range of logistics performance metrics, not just stockouts and carrying cost.[4] It’s a process control problem.
This article covers:
- The 6-link Inventory Accuracy Chain — where records actually break down
- What the data says about benchmarks: average vs. world-class
- The real financial cost when accuracy drops below 95%
- The 6 operational controls that build accuracy without more counting
- Why barcode validation works (and why some barcode projects still fail)
- How Odoo turns the 6 controls into the default path of work
- FAQ + a simple starting diagnostic
The Inventory Accuracy Chain
Inventory accuracy is the output of six upstream accuracy metrics. When any one weakens, total accuracy drops. World-class operations don’t count more — they control each link.
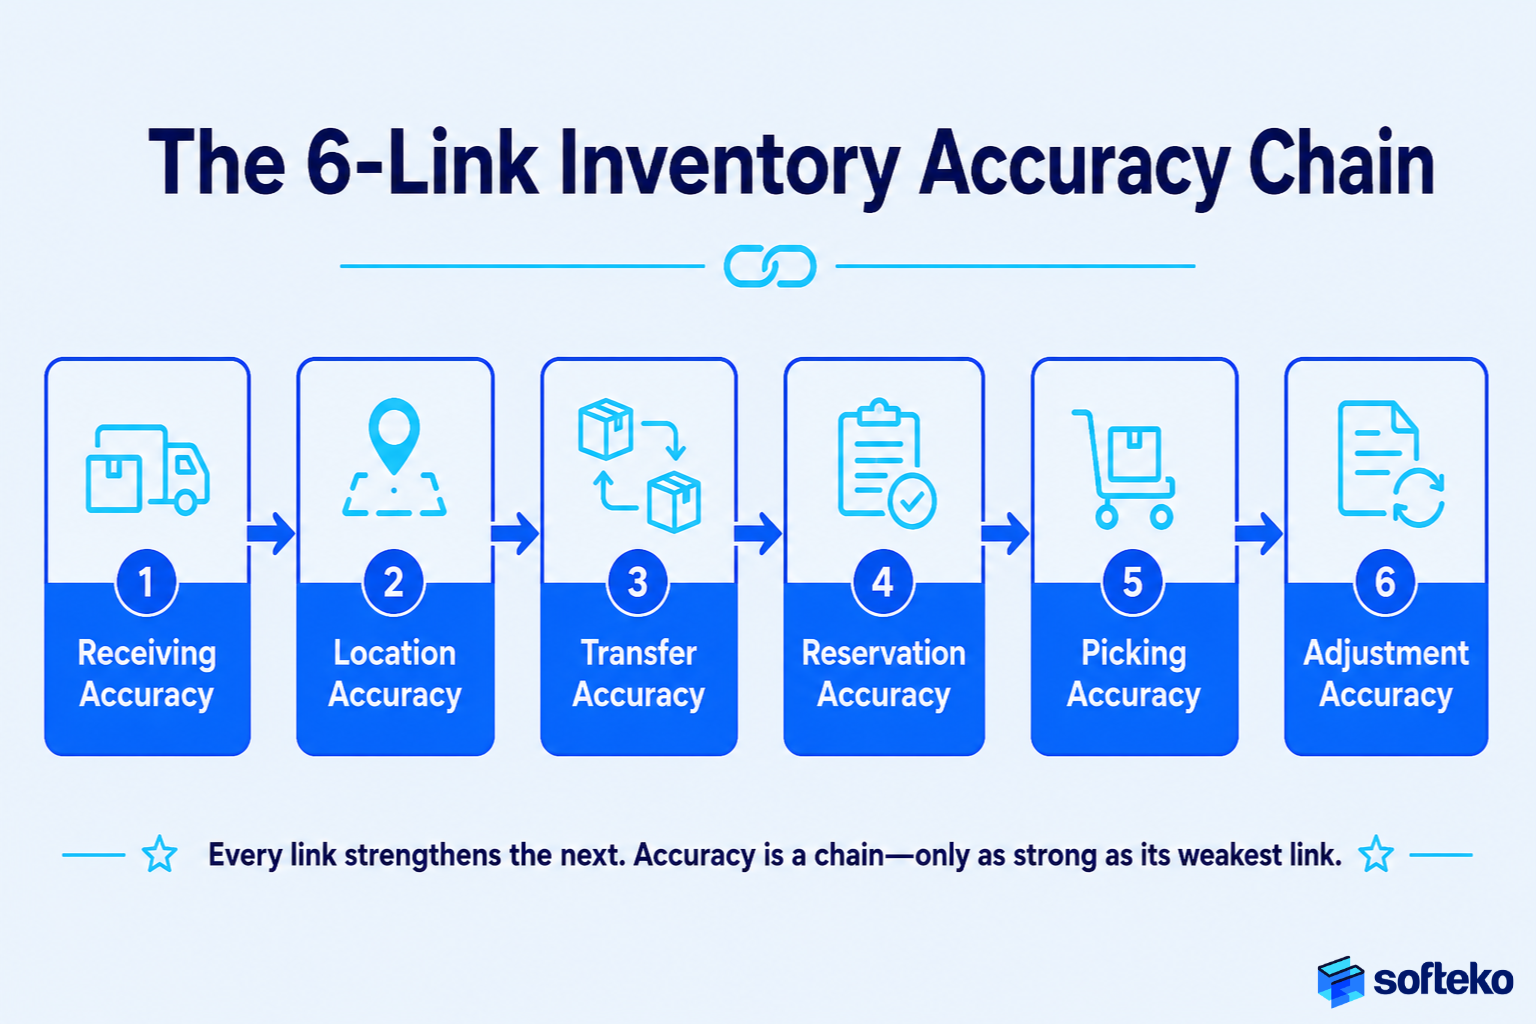
| # | Link | What it controls | How it fails |
|---|---|---|---|
| 1 | Receiving accuracy | What product, qty, and condition arrived | Late posting, partial deliveries marked complete, wrong UoM |
| 2 | Location accuracy | Where stock physically sits vs system | “Ghost inventory” — exists but mis-located |
| 3 | Transfer accuracy | Internal movements between zones / warehouses / 3PLs | Physical move recorded later (or never) |
| 4 | Reservation accuracy | What’s truly available vs reserved / allocated | Sales and ops see different “available” numbers |
| 5 | Picking accuracy | Right SKU, right qty, right batch | Manual verification fails at scale |
| 6 | Adjustment accuracy | What changed and why | Adjustments hide root cause instead of revealing it |
Independent warehouse research and Champion Business Solutions’ root-cause breakdown reach the same conclusion as NetSuite’s analysis: the most common root causes are data-entry errors, incorrect manual counts, spoilage, theft, misplaced inventory, disorganised shipping/receiving, and inaccurate picking[5] — virtually all of which happen before a stock count would ever detect them.
How One Receiving Error Hides For Weeks
A container arrives carrying 1,000 bags of a product. The team unloads, marks it complete in the system, and moves on. Actual quantity received: 980. The 20-bag gap doesn’t surface until weeks later in a cycle count. Meanwhile, sales kept promising inventory that didn’t exist and procurement deferred replenishment.
The mistake happened in 30 seconds at the receiving dock. The cost — false stockouts, customer credits, an emergency PO — accumulates for a month before anyone connects it back to the source.
What Is a Good Inventory Accuracy Rate?
| Inventory accuracy | Operational reality |
|---|---|
| Below 85% | Frequent discrepancies, recurring stockouts, unreliable planning |
| 85–90% | Basic control exists but issues remain routine |
| 90–95% | Acceptable for many growing businesses, visibility gaps remain |
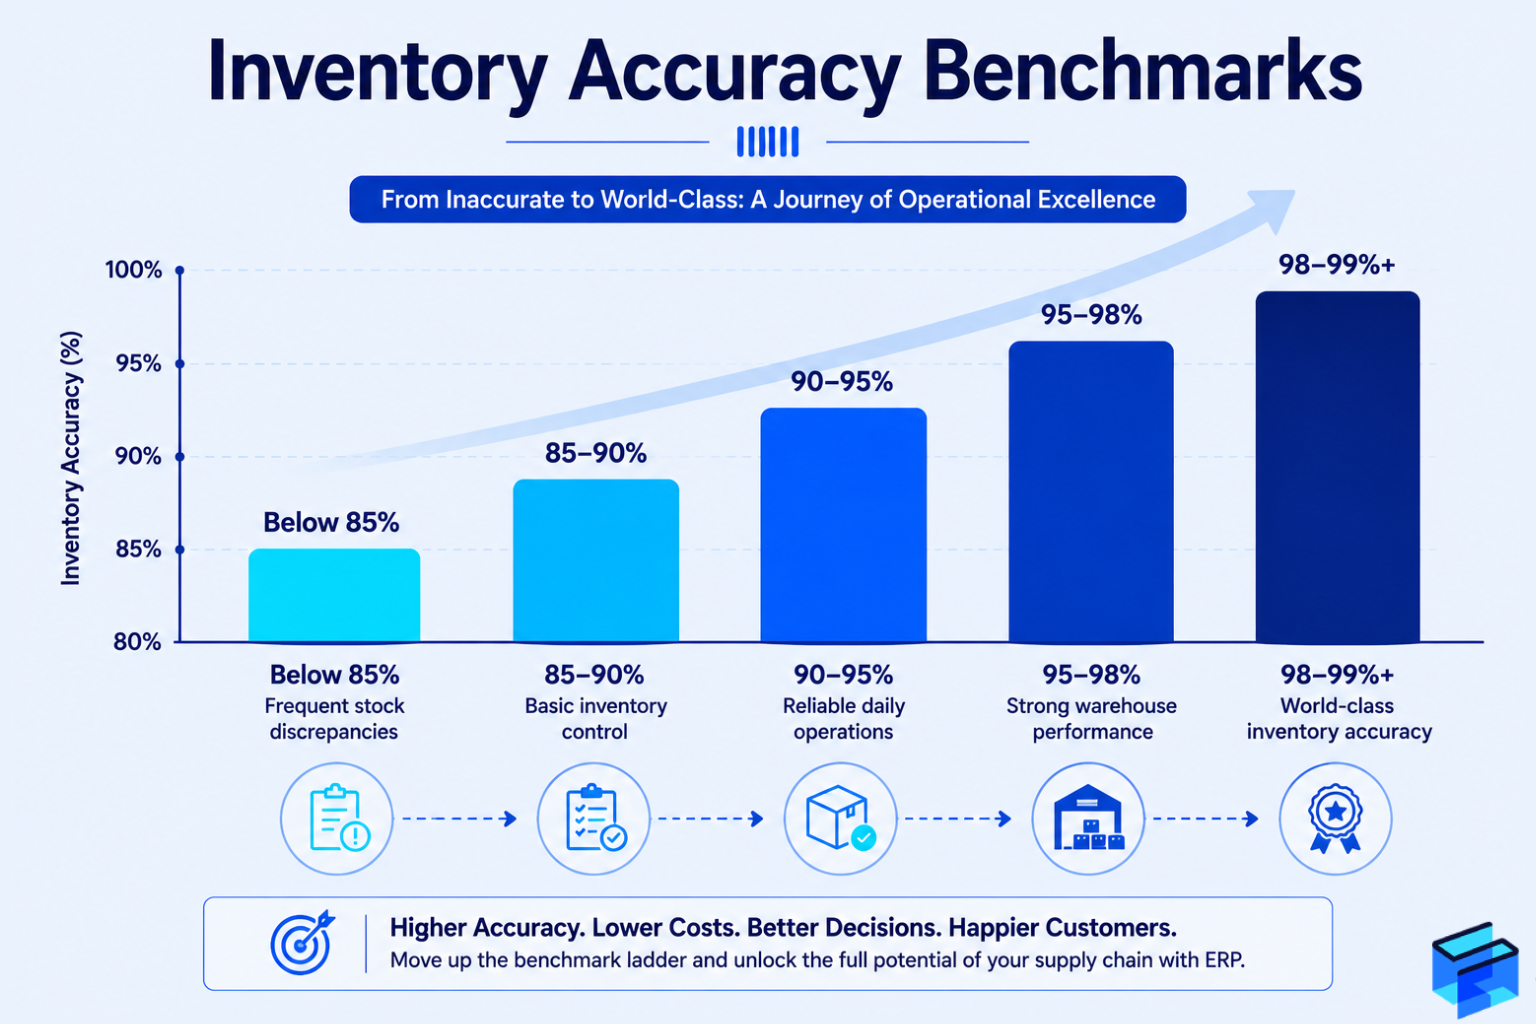
| 95–98% | Strong operational discipline, reliable processes |
| 98–99%+ | Best-in-class — discrepancies are exceptions, not norms |
Benchmark ladder informed by NetSuite / CAPS Research[1], which reports an industry average of 83%and identifies 90%as a common target and 95%as world-class.
A useful sanity-check: only about 69% of companies track inventory accuracy as a KPI at all.[1] The first move toward 99% is, literally, measuring it consistently.
Why Many Businesses Never Reach 95% Accuracy
Not for lack of effort — for lack of process discipline. Management invests in more staff, more inventory, more frequent counts, larger facilities. The root causes (receiving mistakes, unrecorded transfers, inconsistent locations, manual picking) stay untouched. Counts treat the symptom; controls fix the cause.
Why Continuous Improvement Matters More Than 100% Accuracy
Perfect accuracy is hard to sustain in dynamic warehouses with returns, damage, and human movement. The objective isn’t perfection — it’s detection speed. World-class operations don’t have zero errors; they catch and explain them within hours instead of months.
Poor Inventory Accuracy Increases Costs Trading Businesses
Most teams calculate inventory-accuracy cost as stockouts + write-offs + expedites. That’s the visible cost. The total is much larger.
| Cost type | What it looks like | Why it stays invisible |
|---|---|---|
| Carrying cost penalty | Low performers carry inventory at ~3× the cost of top performers (APQC via NetSuite[1]) | Spread across rent, insurance, capital, handling |
| Search labour | Pickers spending 20 minutes on what should be a 3-minute task | Never logged as “inventory cost” |
| False stockouts | System says no, warehouse says yes (or vice versa) — order lost, then product found later | Booked as lost sale, not as accuracy issue |
| Safety-stock inflation | Procurement adds buffer because data can’t be trusted | Looks like good practice |
| Customer churn | Repeated partial shipments, backorders, delivery slippage | Shows up months later in renewal rates |
| Decision distortion | Replenishment, planning and discontinuation decisions made on wrong numbers | Invisible until the wrong product is killed |
| Shrinkage | U.S. retail shrinkage runs ~1.4–1.6% of sales[6] | A small % of a large number is a large number — recent industry estimates put the U.S. retail total at $90–112B[7] |
Add these together and a 5–10 percentage-point drop in inventory accuracy can quietly cost more than most ERP projects ever spend.
Six Inventory Controls That Improve Inventory Accuracy
Notice that none of these require ERP first. ERP makes them scalable — but the controls themselves are process discipline.
| # | Control | Principle |
|---|---|---|
| 1 | Verify at receiving, not later | A discrepancy caught at the dock affects 1 transaction. The same discrepancy caught in a cycle count affects weeks of movements. |
| 2 | Enforce location discipline | Every product has a designated, recorded, and verified location. Tribal knowledge (“Ali keeps it near the loading area”) doesn’t scale. |
| 3 | Make transfers impossible to ignore | No physical movement exists until the system movement exists. |
| 4 | Replace annual counts with cycle counting | Continuous validation in small segments. Catches discrepancies in days, not months. |
| 5 | Investigate every adjustment | An adjustment isn’t a fix — it’s a question. Why did the discrepancy occur? Which process failed? |
| 6 | Accountability without blame | If reporting an error gets you punished, errors stop being reported. The goal is process improvement, not finger-pointing. |
A clean way to test which control is failing: pick your last 20 inventory adjustments. If you can’t explain why each one happened (not just what changed), you’re using adjustments to hide weaknesses, not fix them.
Barcode Validation Prevents Inventory Errors
Barcodes don’t improve accuracy because they’re sophisticated. They improve accuracy because they replace assumption with verification at every transaction.
A 2024 UTS Journal study measured the difference directly: barcode scanning achieved 98.5% transaction accuracy and reduced human input errors by 72% vs manual entry.[2] The gap exists because manual verification depends on memory, fatigue, and visual similarity — barcodes don’t.
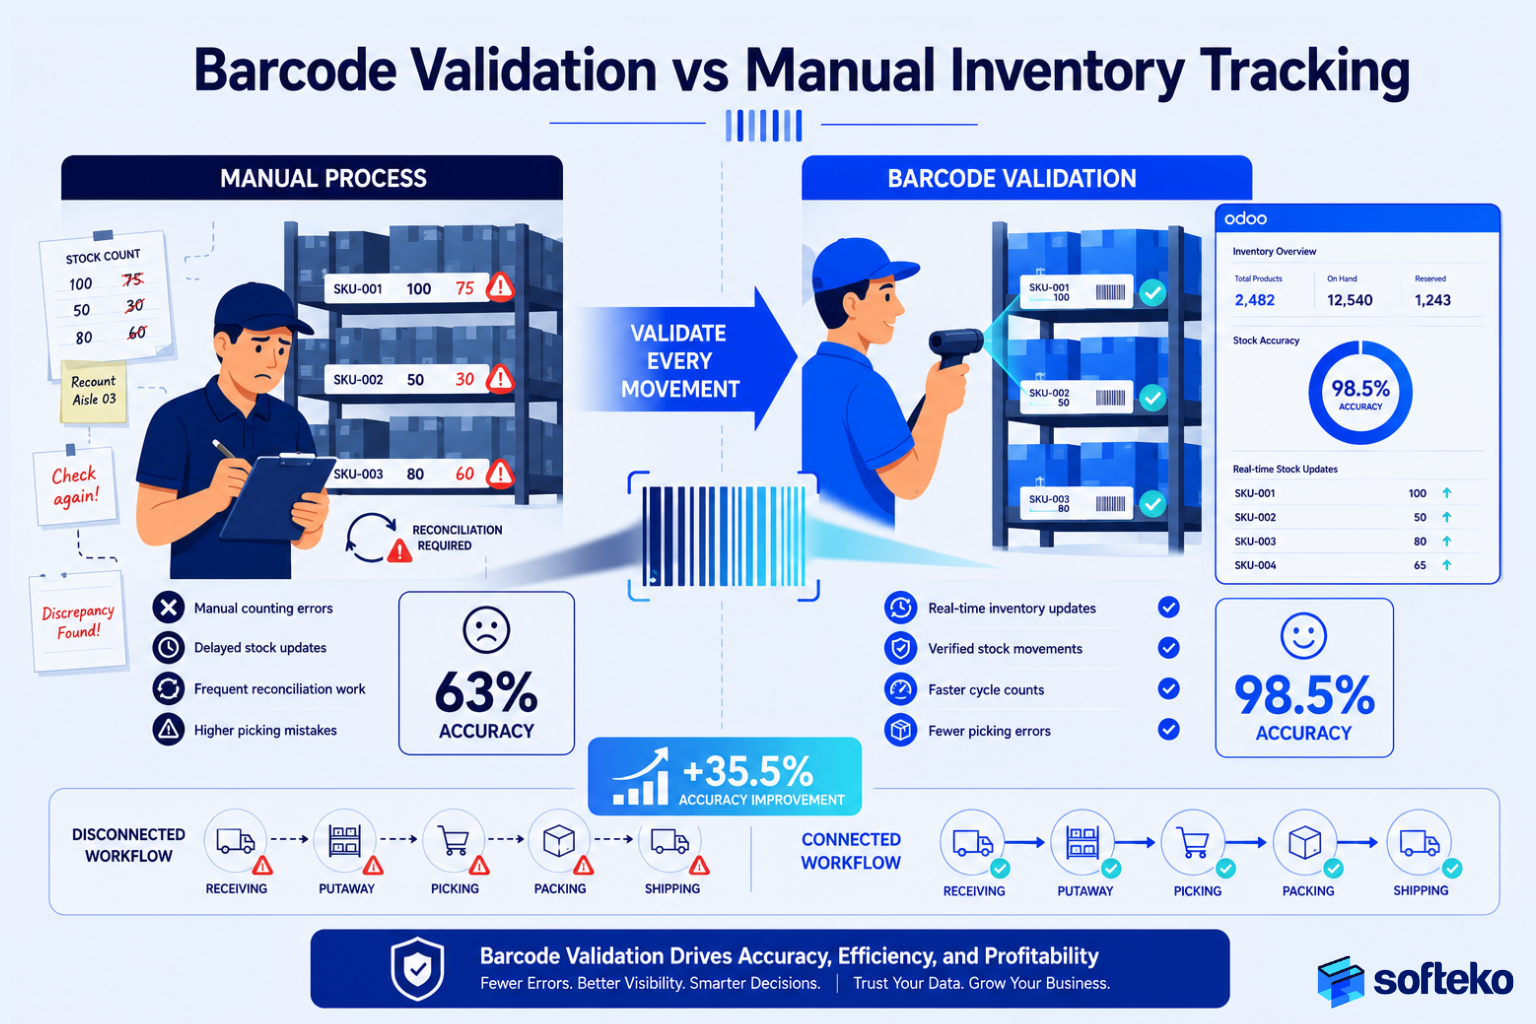
How Barcode Validation Strengthens Every Inventory Movement
| Chain link | What barcode validation does |
|---|---|
| Receiving accuracy | Confirms product + qty at the dock |
| Location accuracy | Validates put-away location |
| Transfer accuracy | Records every move between locations |
| Reservation accuracy | Improves visibility of allocated stock |
| Picking accuracy | Confirms correct SKU and qty at pick |
| Adjustment accuracy | Creates traceable transaction history |
Why Some Barcode Projects Still Fail
A predictable pattern: accuracy drops → management buys scanners → accuracy improves briefly → 6 months later, discrepancies return. The technology didn’t fail; the process did. Barcodes can validate transactions, but they can’t enforce a receiving process where staff still bypass quantity checks. Automation amplifies the process you already have — good or bad.
Inventory Visibility Improves Accuracy More Than Stock Counts
Most businesses discover problems during stock counts. World-class businesses discover problems before counts become necessary.
| Without visibility | With visibility |
|---|---|
| Sales sees one inventory number | One shared inventory record |
| Procurement sees another | Sales, ops, procurement, finance see same data |
| Warehouse sees a third | Reservations, in-transit, on-hand all visible |
| Stockouts and overstock simultaneously | Exceptions surface in hours, not months |
| Annual count = annual panic | Cycle counts confirm what’s already known |
When inventory data fragments across departments, employees start building their own spreadsheets, and the organisation loses its single source of truth. Once that happens, fixing accuracy requires fixing visibility first.
A 2024 narrative review of ERP in inventory management summarises the mechanism well: ERP improves inventory accuracy through real-time data access, reduced manual error, automation, and integration[8] — i.e. it removes the data fragmentation that breaks every one of the 6 chain links.
How Odoo Helps Control Every Inventory Movement
The goal isn’t to make accuracy possible. It’s to make inaccuracy hard. Odoo does this by making every inventory movement a transaction that updates the same shared record, across procurement, warehouse, sales and finance.
| Chain link | Odoo capability | Module |
|---|---|---|
| Receiving | Structured GRN workflow + barcode-supported quantity check | Inventory + Barcode |
| Location | Location-level inventory (warehouse → zone → bin) | Inventory |
| Transfer | Internal transfers + multi-warehouse routes, all recorded | Inventory |
| Reservation | Sales orders, manufacturing, deliveries reserve stock in real time | Sales + Inventory |
| Picking | Barcode-validated picking (operation type-based) | Inventory + Barcode |
| Adjustment | Inventory adjustments with reason codes + full movement history | Inventory |
| Cycle counting | Counts scheduled and tracked per location, never global panic | Inventory |
| Cross-team visibility | One stock record visible to Sales, Procurement, Warehouse, Finance | All four |
The value isn’t that Odoo calculates inventory accurately. The value is that Odoo makes invisible inventory movements impossible at scale.
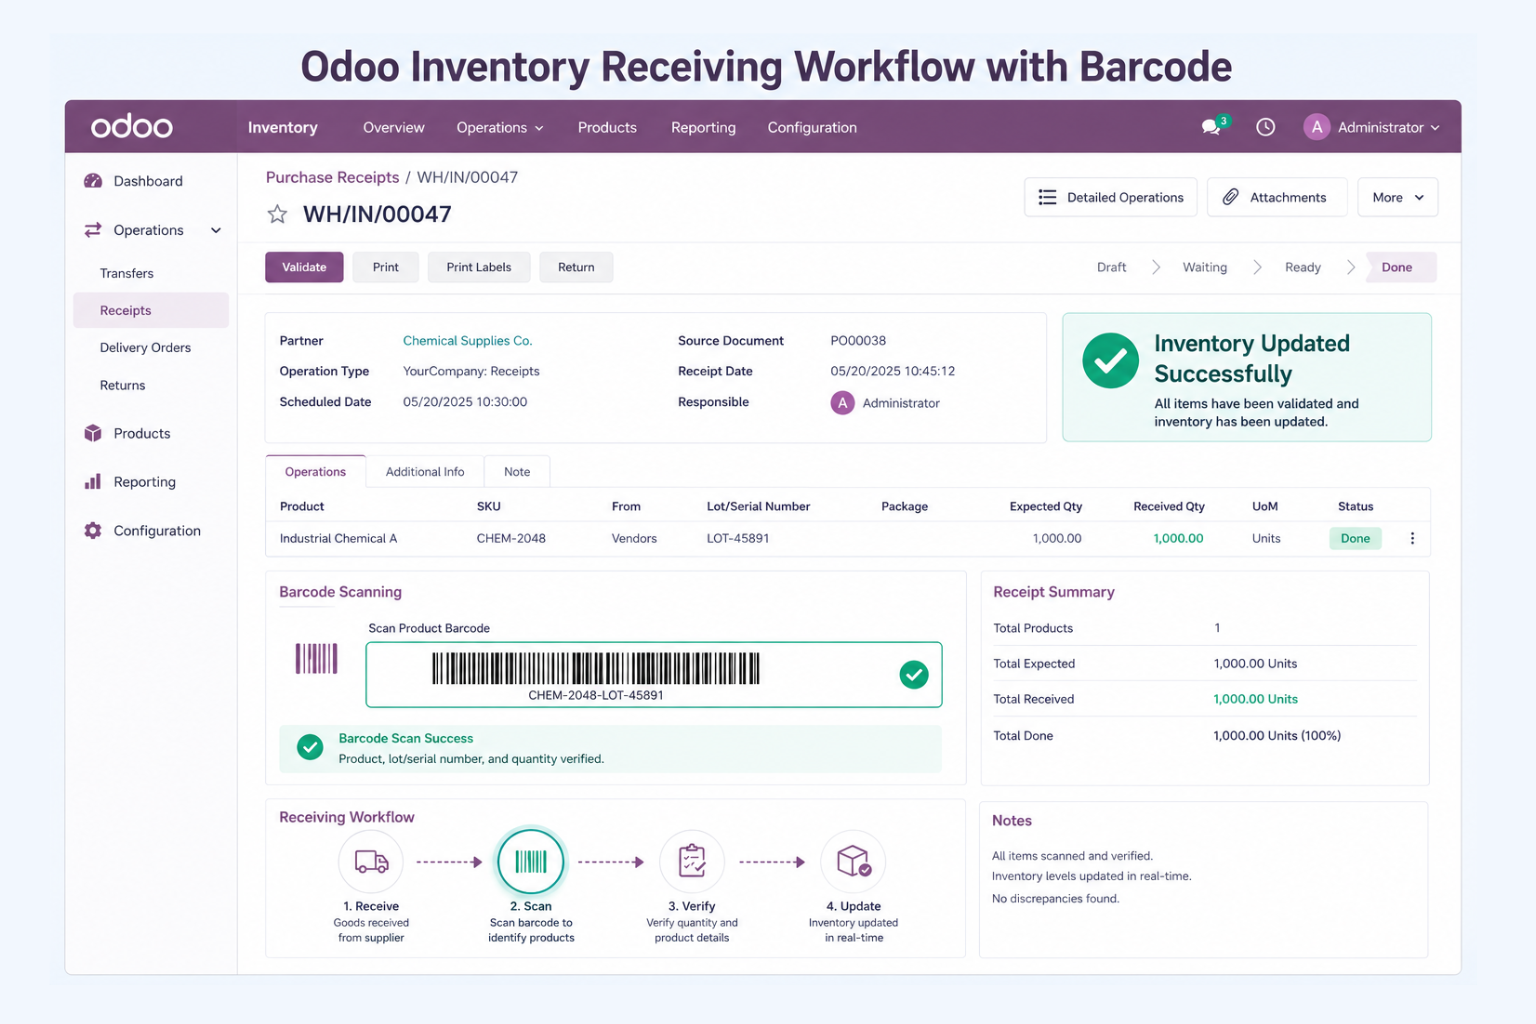
ERP Cannot Improve Inventory Accuracy Without Good Warehouse Processes
Some businesses report dramatic accuracy improvements after ERP go-live. Others report little change. The software is often the same. The difference is whether the 6 operational controls existed first.
If receiving is still bypassed, if transfers are still verbal, if adjustments are still routine housekeeping — ERP just digitises the same problems faster. The implementations that consistently reach 98%+ accuracy fix process first, then deploy the system to enforce what already works.
A simple starting diagnostic
Before changing anything, run this on your operation:
| Question | Answer source |
|---|---|
| What % of SKUs were counted in the last 90 days? | Cycle-count records |
| What % of inventory adjustments in the last quarter have a documented root cause? | Adjustment log |
| What % of internal transfers were posted within 4 hours of the physical move? | Transfer log |
| What % of receiving discrepancies were captured at the dock vs at cycle count? | GRN records |
| Do Sales, Procurement, Warehouse and Finance see the same “available” number for your top 10 SKUs right now? | Test today |
If any of these answers are uncomfortable, the issue is visibility and control — not counting.
Improve Inventory Accuracy with an Odoo Assessment
If your records keep disagreeing with physical stock, the problem isn’t the count. It’s somewhere in the six-link chain — receiving, location, transfer, reservation, picking, or adjustment.
At Softeko, we help trading businesses map inventory workflows, identify where visibility breaks down, and implement Odoo ERP as a single source of truth across warehouse, sales, procurement and finance operations.
Whether you run one warehouse or twenty, the objective is the same: make every inventory movement visible, every inventory decision reliable, and every discrepancy traceable to its source.
FAQ
What is a good inventory accuracy rate?
90% is a practical target for growing businesses; 95% is the threshold for world-class operations.[1] The industry average is 83%.
What causes most inventory discrepancies?
Data-entry errors, manual miscounts, misplaced stock, unrecorded transfers, disorganised receiving, and inaccurate picking — almost all upstream of the actual stock count.[1][5]
Will barcode scanning solve my inventory problem?
It will solve a large part of it. Studies show barcode validation reaches 98.5% transaction accuracy and reduces manual errors by 72%.[2] But only if your process controls (receiving, location, transfer discipline) are sound first.
How is inventory accuracy different from inventory control?
Accuracy answers “do we know what we have?” Control answers “do we have the right amount?” You can be 100% accurate and still chronically overstocked.
How often should we cycle count?
Daily, on a rolling basis, segmented by ABC class. The goal is that every SKU is counted multiple times per year — without ever shutting the warehouse for an annual count.
Why does inventory accuracy fall in multi-warehouse operations?
Every transfer between locations is another opportunity for a missed posting. A single unrecorded transfer makes both the source and destination inaccurate. Centralised visibility across warehouses is the only structural fix.
How does Odoo specifically support 99% accuracy?
Through location-level inventory, barcode validation at every operation type, recorded internal transfers, real-time reservations, traceable adjustments with reason codes, and cycle counting per location — all reading from one shared stock record.
References
- NetSuite — Inventory Accuracy (CAPS Research — 83% average; 69% tracking; 90/95% targets; APQC 3× carrying-cost penalty) — https://www.netsuite.com/portal/resource/articles/inventory-management/inventory-accuracy.shtml
- UTS Journal of Information Systems (2024) — Barcode Scanning Study: 98.5% accuracy, 72% error reduction — https://jurnal.uts.ac.id/JINTEKS/article/download/6929/3059/24979
- Finale Inventory — Benefits of a Barcode Inventory System (63% manual → 99.9% scanned) — https://www.finaleinventory.com/barcode-inventory-system/benefits-of-barcode-inventory-system
- APQC — Inventory Accuracy Improves Performance on Logistics Metrics (2015) — https://www.apqc.org/resource-library/resource-listing/inventory-accuracy-improves-performance-logistics-metrics
- Champion Business Solutions — Root Causes of Inventory Errors — https://www.champion-business-solutions.com/post/root-causes-of-inventory-errors-the-usual-suspects
- Statista — Median Retailers’ Inventory Shrinkage Rate, US — https://www.statista.com/statistics/1456467/median-retailers-inventory-shrinkage-rate-us/
- VNDLY — 2024–25 Retail Shrinkage Industry Estimates — https://www.vndly.io/blog/inventory-shrinkage-statistics-2026
- Journal Sinergi (2024) — ERP in Inventory Management: Narrative Review — https://journal.sinergi.or.id/index.php/ijl/article/view/622