

Key takeaways
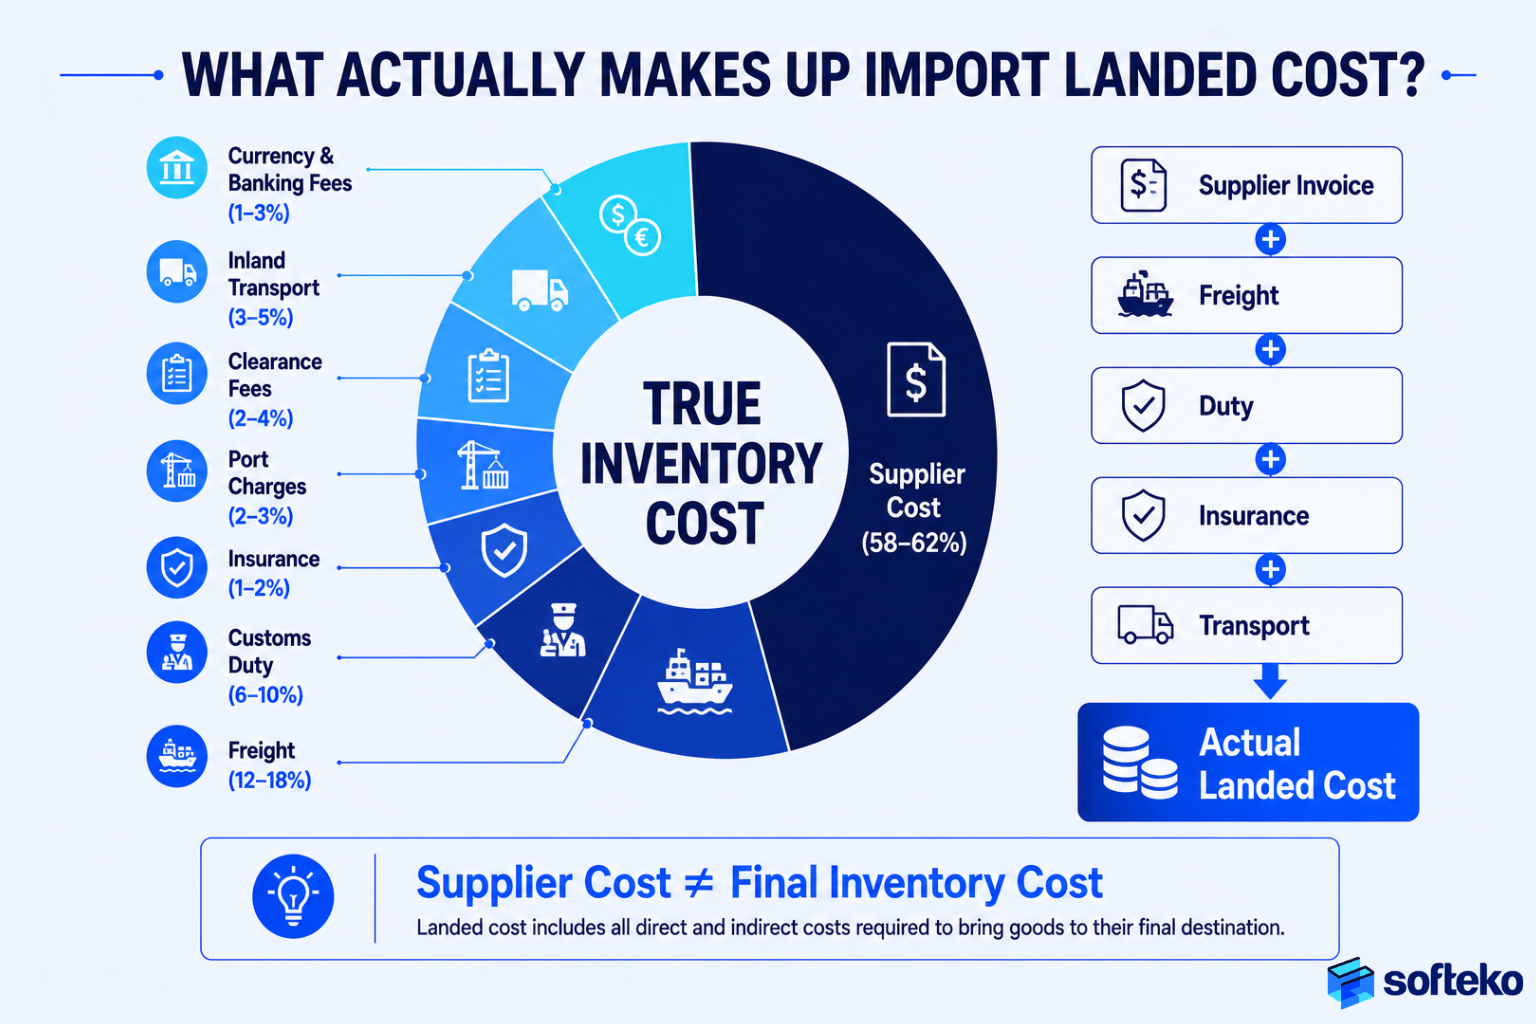
- For a typical import, the supplier invoice is usually only 58–62% of total landed cost at higher order volumes; freight alone runs 12–18% depending on order size.[1]
- The other 38–42% — freight, duties, insurance, handling, currency, fees — arrives after the goods do. Inventory is already in stock before you know what it cost.[1]
- A 1% rise in the ad-valorem freight rate cuts aggregate import values by 5–6×, per World Bank research[2] — freight volatility is a margin variable, not an overhead.
- 73% of supply-chain leaders expect to hit a “tariff-absorption wall” by end-2026 — the point where margins can no longer absorb trade costs.[3]
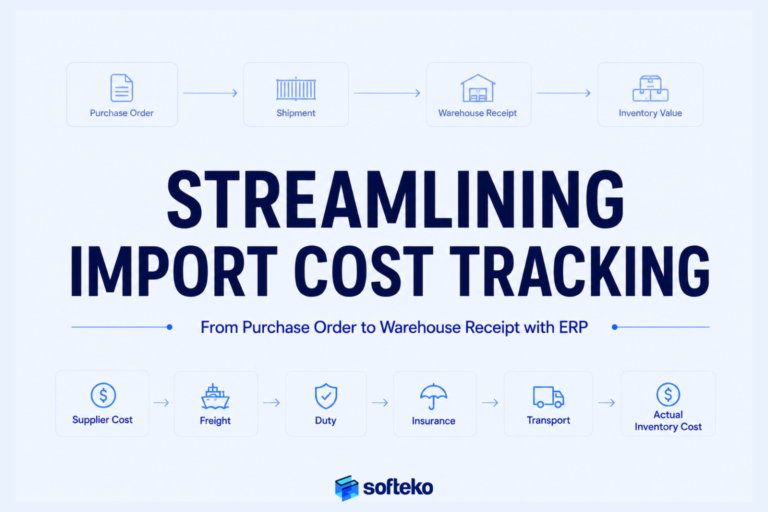
- The fix isn’t a better landed-cost formula. It’s traceability — keeping every cost attached to the right shipment from PO through warehouse receipt to inventory valuation.
Overview
A Purchase Order (PO) might show that you bought a container of raw materials for $50,000. The PO almost never reflects what the inventory actually costs.
By the time imported goods reach your warehouse, expenses have accumulated across at least eight parties — supplier, freight forwarder, shipping line, insurance provider, customs authority, port operator, clearing agent, inland transporter. Each invoices independently. Invoice arrives on a different timeline. Each affects inventory value.
Most procurement teams see only the supplier price. Logistics sees freight. Customs brokers see duties. Finance receives invoices weeks later. Meanwhile, the warehouse takes inventory in before most of those costs are known.
The result is one of the most common visibility problems in trading: nobody knows the true inventory cost when the inventory actually arrives.
This article covers:
- The 8-stage import cost journey (and when each cost becomes visible)
- Why the supplier price is the most predictable part of import costing, not the largest
- How estimated vs. actual cost variance creates margin surprises
- The 7 most common cost-tracking failures
- Landed cost allocation: 4 methods + when each fits
- The 4-layer Import Cost Traceability Framework
- How Odoo preserves cost traceability from PO to inventory valuation
- A simple audit + FAQ
If you’ve read the How ERP Helps Calculate Landed Cost and Protect Profit Margins in Trading Businesses post in this series, this one is the operational companion — how to actually keep landed cost connected to the right inventory as transactions move through procurement, logistics, customs, warehouse and finance.
The complete import cost journey
Imports are not a single transaction. They are a sequence of costs — each becoming visible at a different moment.
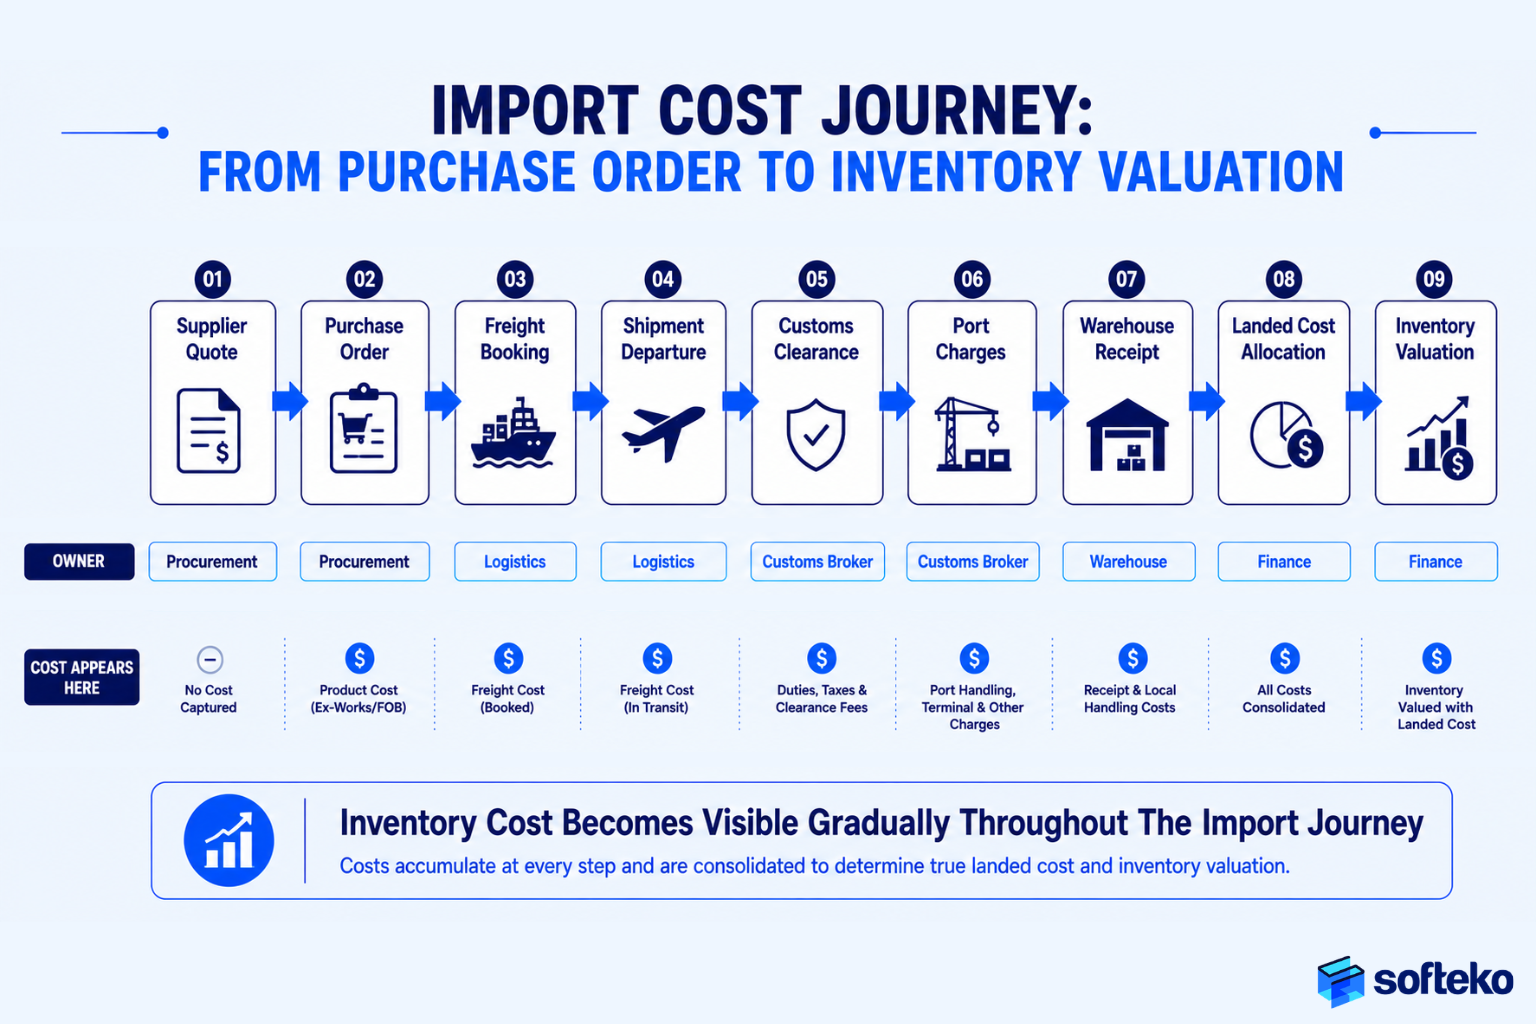
The 8 Stages Where Import Cost Gets Added
| Stage | Cost component | Visibility timing | Owner |
|---|---|---|---|
| 1 | Supplier cost | Before PO | Procurement |
| 2 | Freight cost | Pre-shipment / during transit | Logistics |
| 3 | Insurance cost | Pre-shipment | Logistics + Finance |
| 4 | Customs duty | After arrival | Customs broker |
| 5 | Port charges | During clearance | Logistics |
| 6 | Clearing agent fees | During clearance | Customs broker |
| 7 | Inland transportation | Before warehouse receipt | Logistics |
| 8 | Adjustments (demurrage, storage, revised duties, inspection) | After receipt | Multiple |
Typical Landed Cost Breakdown by Order Volume
Ownlybrand’s analysis of wholesale import pricing breaks down the cost composition by order volume — useful because the supplier-cost share shifts dramatically with scale:
| Cost component | % of landed cost (500 units) | % of landed cost (5,000 units) |
|---|---|---|
| Unit manufacturing (supplier price) | 58% | 62% |
| Ocean freight & logistics | 18% | 12% |
| Import duties & taxes | 9% | 8% |
| QA & inspection | 5% | 3% |
| Packaging & documentation | 4% | 3% |
| Payment & currency fees | 3% | 2% |
The freight share alone moves from 18% to 12% as volume scales — and that’s before freight market volatility kicks in.
Why Cost-Tracking Breaks Down With Timing Gaps
A representative timeline:
| Day | Event |
|---|---|
| 1 | PO issued |
| 10 | Freight booked |
| 25 | Shipment departs |
| 45 | Goods arrive |
| 48 | Warehouse receipt completed |
| 60 | Freight invoice received |
| 68 | Customs invoice received |
| 75 | Final clearance invoice received |
Inventory may be available for sale on Day 48 — but the final 38–42% of its cost isn’t known until Day 75.
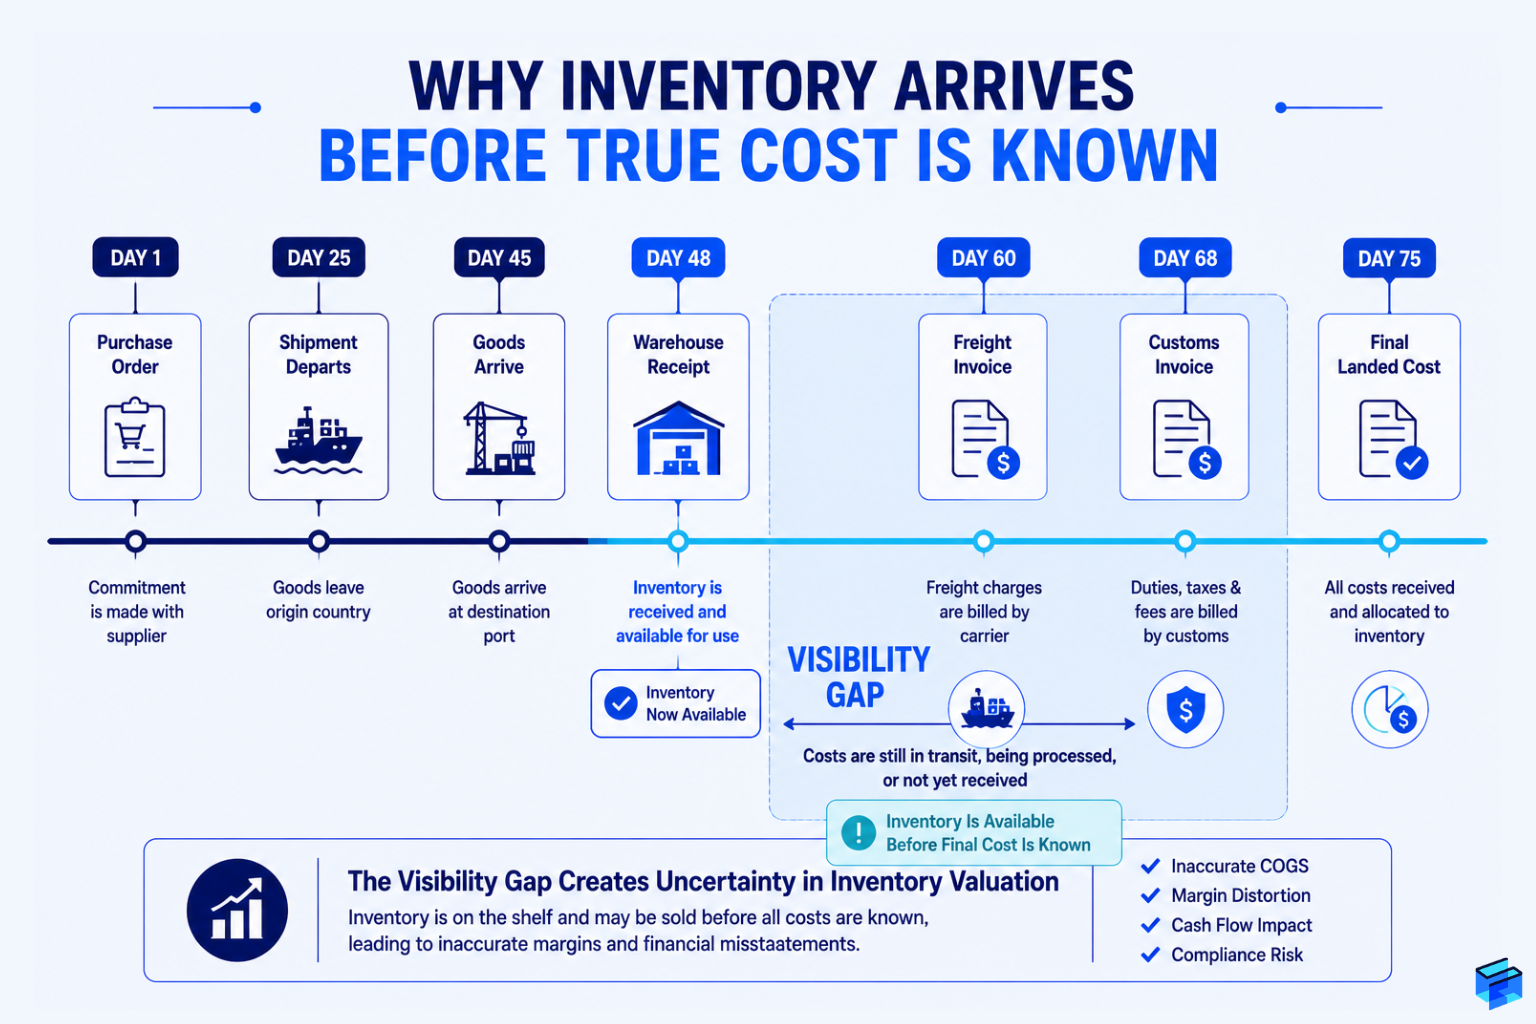
During that window:
- Inventory values are estimates
- Margins are provisional
- Pricing decisions rely on assumptions
- Profitability reporting is incomplete
Independent research from Microsoft’s Dynamics 365 supply-chain analysis describes exactly this pattern: costs accumulate across PO → Transit → Receipt → Cost Assignment stages, not at a single point — and the gap between receipt and final cost assignment is where margin surprises develop.[12]
Supplier Cost Covers Only Part of the Final Inventory Cost
A PO confirms five things: product, quantity, supplier price, payment terms, delivery terms. It does not confirm:
- Final freight expense
- Actual customs duty
- Clearance costs
- Demurrage risk
- Storage charges
- Inland delivery expense
- Exchange-rate impact
- Additional compliance costs
These all emerge later. Yet many organisations continue treating the supplier invoice as if it represents final inventory value.
How Incoterms Determine Your Total Import Cost
Two identical products at the same supplier price can have completely different landed costs depending on Incoterms.
Under,
– FOB (Free On Board), the buyer absorbs most transport and logistics.
– CIF (Cost, Insurance & Freight), some costs are embedded in the supplier price.
– DDP (Delivered Duty Paid), even duties are included.
A lower supplier price does not necessarily produce a lower landed cost. Often the opposite — comparing supplier quotations without normalising for Incoterms is misleading.
Rising Transportation Costs Can Reduce Profit Margins
World Bank research quantifies this directly: a 1% increase in the ad-valorem freight rate produces a 5–6× fall in aggregate import values. And more recent World Bank analysis confirms that international shipping rates for commodities and bulk goods remain “highly volatile, mostly due to shipping demand shocks.”[2] Freight is now a margin variable, not an overhead.
Why Actual Cost Always Differs From Estimated Cost
Every importer works with estimates. The problem begins when estimates quietly become “facts” inside reports.
| Cost type | Source | When known |
|---|---|---|
| Estimated landed cost | Pre-shipment quotations, historic rates, assumed duty | Day 1 — used for quoting, pricing, margin approval |
| Actual landed cost | Real invoices from freight, customs, clearance, transport | Day 60–90 — visible only after reconciliation |
Small Cost Changes Can Eliminate Your Expected Margin
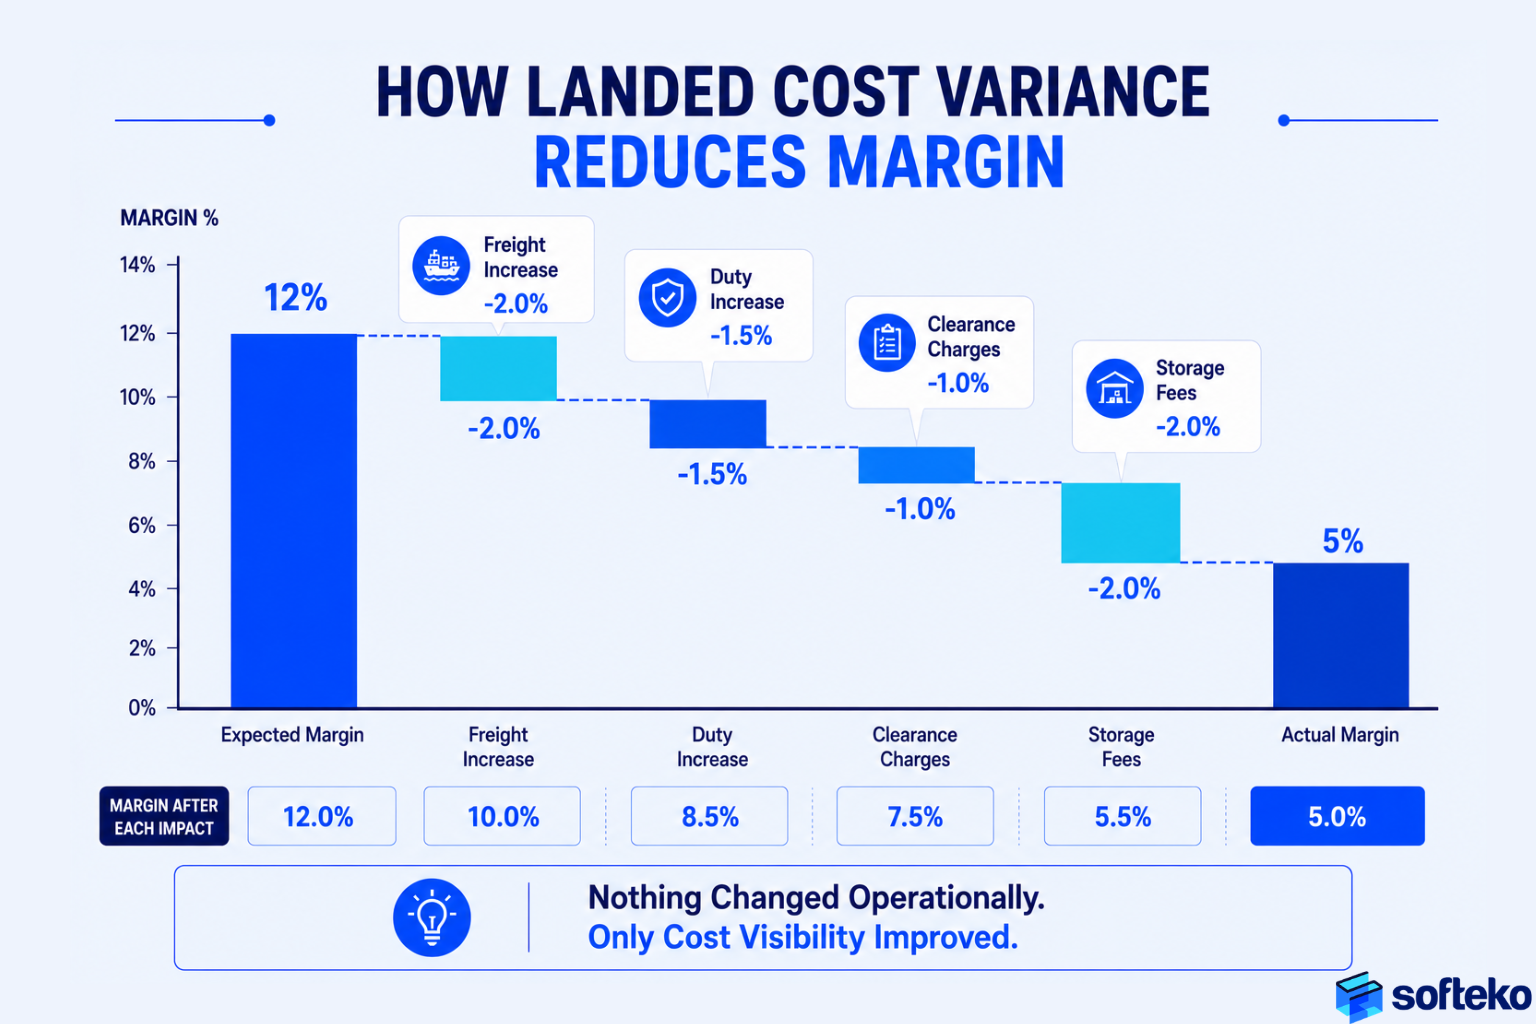
Imagine a product quoted at $1,000/MT landed cost with an expected 12% selling margin. Several weeks later, actual freight and customs costs add $70/MT to inventory value. The true margin becomes ~5%. Nothing changed operationally — the shipment was identical. Only visibility improved.
Track Cost Variance Instead of Only Final Cost
InvoiceDataExtraction’s 5-step reconciliation framework [5] describes the controls needed:
- Record receipt against shipment; assign estimated charge using policy basis
- Store references for AP to match later freight / customs / broker documents
- When actual invoice arrives, compare expected vs. actual amount + allocation basis
- Determine which items are still in stock vs. in production vs. sold (cost of sales)
- Post true-up — revalue inventory, book variance, or split the effect
That fifth step is where most spreadsheet-based systems fail: inventory has already moved through sales channels before the true-up gets posted.
| Metric to track | Purpose |
|---|---|
| Estimated landed cost | Decision-making before shipment |
| Actual landed cost | True inventory value |
| Cost variance | Forecasting accuracy |
| Margin variance | Profitability impact |
| Freight variance | Logistics performance |
| Duty variance | Customs assumptions |
Without variance analysis, the organisation makes the same costing mistakes shipment after shipment. Oracle’s landed-cost reporting documentation describes the variance reports as showing “variances between PO price and voucher price for all landed cost components”[6] — exactly what allows the feedback loop to close.
7 Common Failures in Import Cost Tracking
| # | Failure | What it looks like |
|---|---|---|
| 1 | Cost fragmentation across departments | Procurement, logistics, customs, warehouse, finance each own a piece — no one owns the picture |
| 2 | Freight invoices arrive after inventory receipt | Goods in stock and selling before freight invoice posts; reconnecting cost to inventory becomes hard |
| 3 | Customs & clearance costs booked separately from inventory | Charged to general expense accounts; inventory remains understated |
| 4 | Inconsistent allocation methods | Quantity vs weight vs volume vs value — two finance managers get two different landed costs for the same shipment |
| 5 | Late costs not reapplied to existing inventory | Demurrage, storage, revised freight expensed immediately; inventory value never updated |
| 6 | Spreadsheet traceability breaks at scale | Duplicate freight entries, missing customs charges, version drift |
| 7 | No visibility into outstanding costs | Reports mix confirmed costs with assumptions — false confidence in the numbers |
As LinkedIn analysis on landed cost in distribution companies puts it: “Ignoring landed costs leads to undervalued inventory and misleading financial reports.”[7] Rand Group’s analysis on tariffs and landed cost reaches the same conclusion: “Failing to account for these expenses can lead to inaccurate pricing and margin reporting.”[8]
Choose the Right Method to Allocate Landed Costs
Capturing costs is half the challenge. The second half is distributing them correctly to products. The allocation method determines inventory valuation, COGS, product profitability, pricing and margin analysis — all five at once.
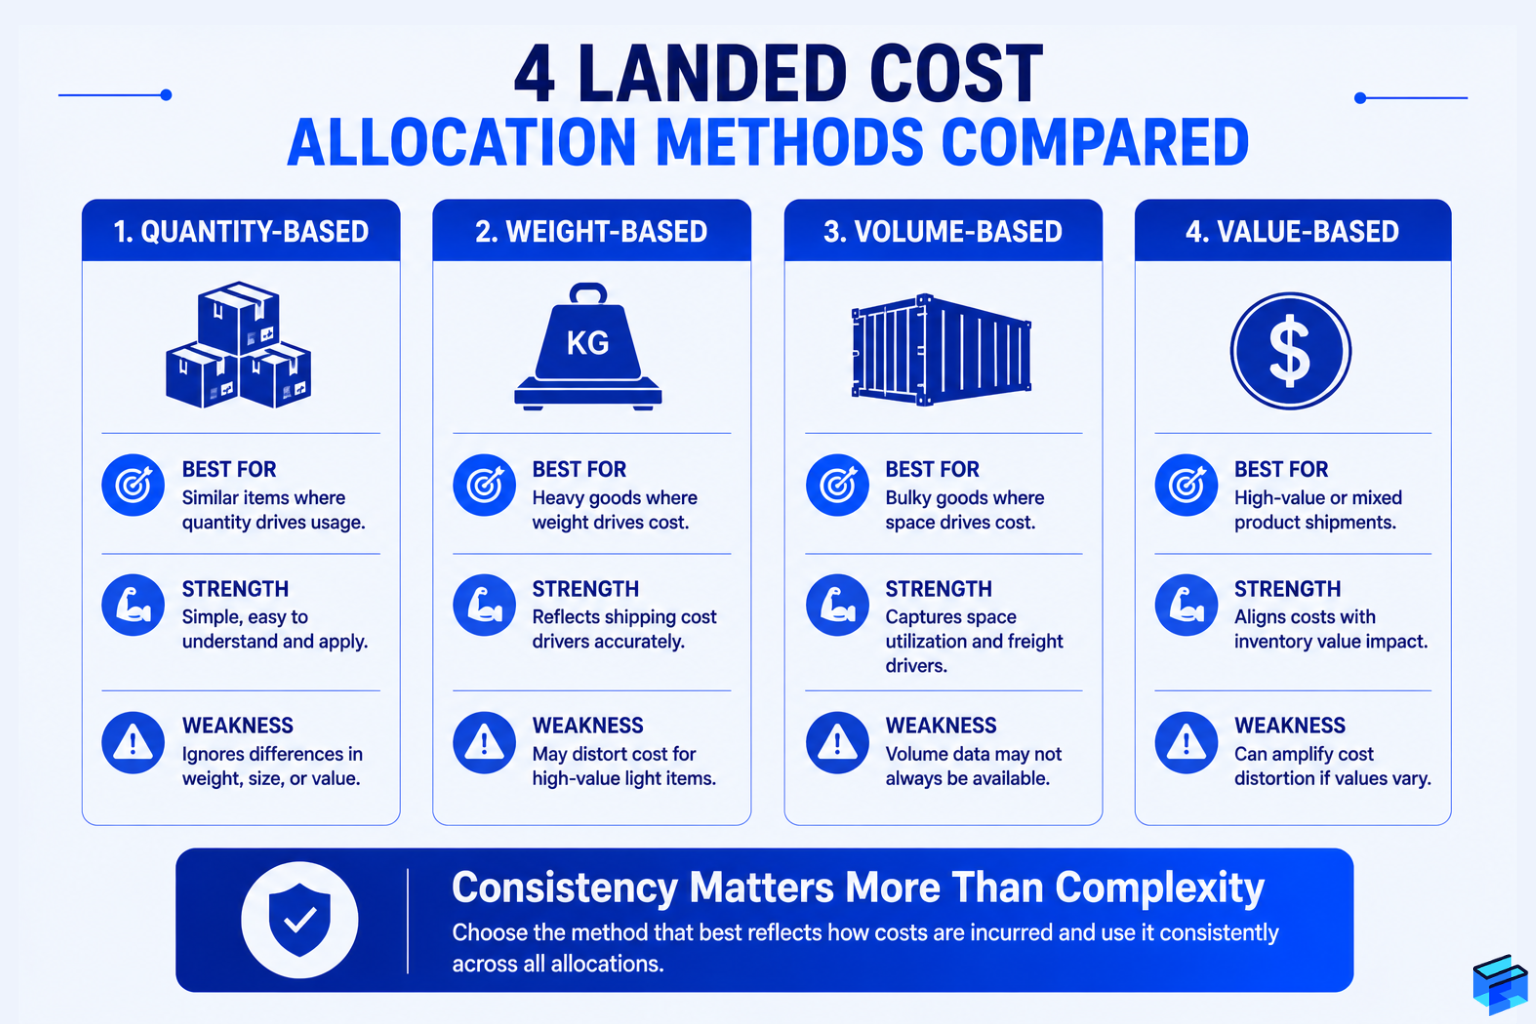
| Method | How it works | Best for | Weakness |
|---|---|---|---|
| Quantity-based | Cost distributed by units / qty received | Similar products in same shipment | Ignores value & freight intensity |
| Weight-based | Cost distributed by shipment weight | Bulk cargo, chemicals, commodities, industrial raw materials | Penalises low-margin heavy products |
| Volume-based | Cost distributed by container space occupied | Packaging materials, lightweight industrial goods, consumer goods | Requires accurate volume data |
| Value-based | Cost distributed by product value | Mixed-value shipments, accounting alignment | Expensive products absorb disproportionate freight |
There is no universal answer. What matters most is consistency — using the same method for similar shipments. A business that changes methods produces inventory values that can’t be compared shipment to shipment.
Consistent Cost Allocation Matters More Than the Allocation Method
The allocation method itself is rarely the biggest challenge. The bigger challenge is maintaining a documented connection between:
- Shipment cost →
- Cost allocation rule →
- Inventory valuation →
- Product profitability
If inventory valuation cannot be explained, profitability cannot be trusted.
Incorrect Import Costs Lead to Incorrect Inventory Values
A small valuation error creates a chain reaction:
Inventory understated → COGS understated → Gross profit overstated → Decisions made on wrong numbers
This is particularly dangerous when commodity prices fluctuate, freight markets are volatile, duty structures change, or product margins are thin. A 3–5% cost variance can completely eliminate profitability on certain transactions.[10]
A common scenario:
| Metric | Initial report | After landed cost reconciliation |
|---|---|---|
| Revenue | $500,000 | $500,000 |
| Inventory cost | $400,000 | $435,000 |
| Gross profit | $100,000 | $65,000 |
| Gross margin | 20% | 13% |
Nothing changed operationally. Only visibility improved. As analysis on inventory valuation in bonded zones frames it: undervalued inventory = artificially lower COGS = artificially higher reported profits — and that creates both tax exposure and bad management decisions.[11]
What mature operations measure
Strong import operations don’t just track inventory value. They track valuation confidence:
- Estimated landed cost
- Confirmed landed cost
- Outstanding costs
- Pending invoices
- Cost variance
- Inventory value exposure
That distinction — known costs vs. assumed costs — is what improves decision quality.
Build Import Cost Traceability from Purchase Order to Inventory
Most import costing problems share one root cause: costs exist, but the connections do not. The supplier invoice exists. The freight invoice exists. The customs payment exists. The warehouse receipt exists. The accounting entries exist. What’s missing is the ability to follow every dollar from PO to final inventory value.
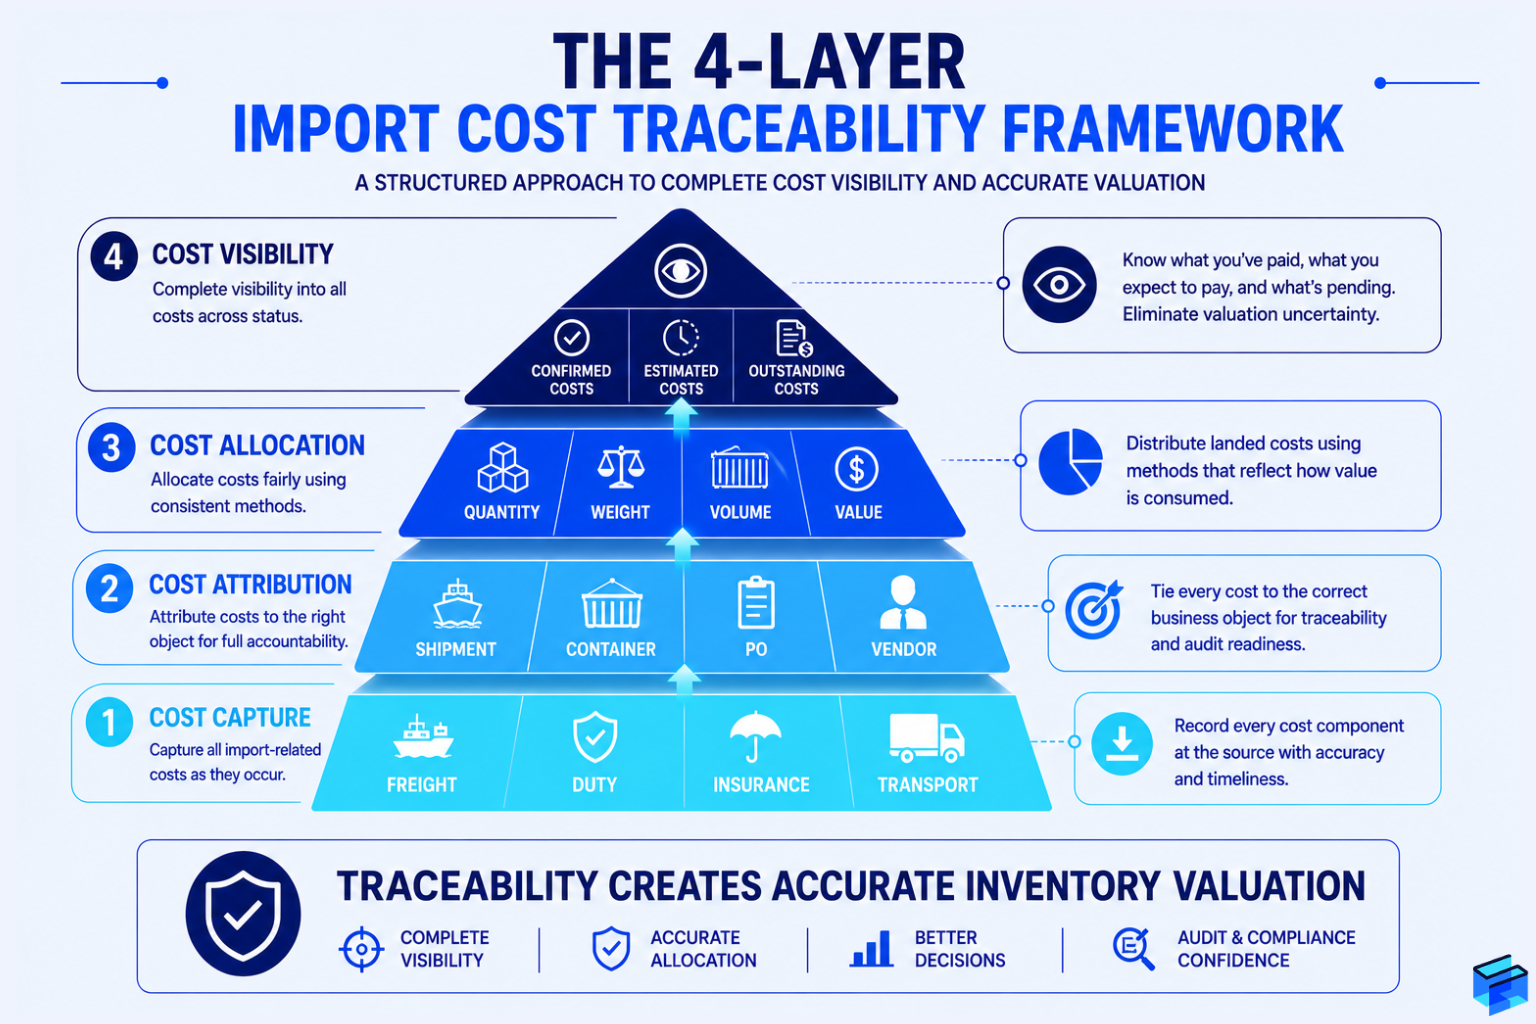
The Four Layers of Import Cost Traceability
| Layer | What it ensures | What it answers |
|---|---|---|
| 1. Cost capture | No shipment cost remains invisible | “Did we record everything?” |
| 2. Cost attribution | Every cost links to a specific shipment | “Which shipment does this charge belong to?” |
| 3. Cost allocation | Costs assigned to inventory using consistent rules | “How much does each product carry?” |
| 4. Cost visibility | Real-time view of confirmed vs estimated vs outstanding | “What do we actually know right now?” |
Test Whether Every Import Cost Can Be Traced
Pick any inventory item in stock right now. Can your team immediately identify:
- Original supplier cost
- Freight allocation
- Duty allocation
- Clearance allocation
- Additional adjustments
- Final landed cost
If the answer requires multiple spreadsheets, emails and manual calculations, traceability is weak. If it appears from a single record, traceability is strong.
Why Traceability Matters More Than Calculation
Most businesses already know how to calculate landed cost. The challenge is preserving the connections between costs as transactions move through departments. Import profitability doesn’t fail because companies can’t do the arithmetic — it fails because information becomes fragmented.
The trade context is becoming less forgiving on this point. TradeVerifyd’s analysis reports that 73% of supply-chain leaders expect to hit their “tariff-absorption wall” by end-2026 — the point at which internal margins can no longer offset trade costs.[3] Combined with escalating U.S. tariff structures raising the effective rate toward ~16%[12], the days of treating duties as a rounding error are gone.
The organisations that consistently protect margins aren’t better at costing — they’re better at preserving traceability as shipment volume, supplier count and cost complexity grow.
How ERP Connects Every Import Cost in One Workflow
Once shipment volume passes a threshold, manual tracking breaks down. Import costing isn’t a single workflow — it’s the intersection of procurement, logistics, inventory and finance. An ERP’s job isn’t to calculate landed cost (any spreadsheet can do that). Its job is to maintain visibility across the entire import cost journey.
The connected workflow looks like:
Supplier Quotation → PO → Shipment → Warehouse Receipt → Cost Allocation → Inventory Valuation → Profitability Reporting
Each transaction stays part of the same operational record. Oracle’s Global Trade Management documentation describes the result as visibility into “the all-in cost of getting a shipment from provenance to ultimate destination” — including automated recording of actual costs (product pricing, discounts, import duties) to support informed decisions and reduce financial losses.[13]
| Without ERP | With integrated ERP |
|---|---|
| Cost data fragmented across departments | One shared transaction record |
| Freight invoices reconnected manually after receipt | Invoices linked back to shipment + GRN + inventory automatically |
| Customs/clearance costs booked to overhead | Costs attached to inventory value at the receipt level |
| Allocation methods vary by person | Standardised allocation rule per shipment / product class |
| Estimate vs actual gap discovered at month-end | Variance visible as actual invoices arrive |
| “Which shipment generated this charge?” — investigation | Documented from charge → shipment → product → customer |
The “venture” concept used in trade-specialised ERPs describes the same principle: every single inbound shipment is tied to a PO, and every cost, document and logistics update gets attached to that venture[14] — so you can answer for any product which venture sold goods came from, what they cost to land, and what margin was made.
How Odoo Tracks Import Costs Across Procurement, Logistics, and Finance
Odoo treats import costing as a connected operational workflow rather than a standalone accounting process. Instead of treating procurement, inventory, logistics and finance as separate functions, Odoo links them through a common transaction flow.
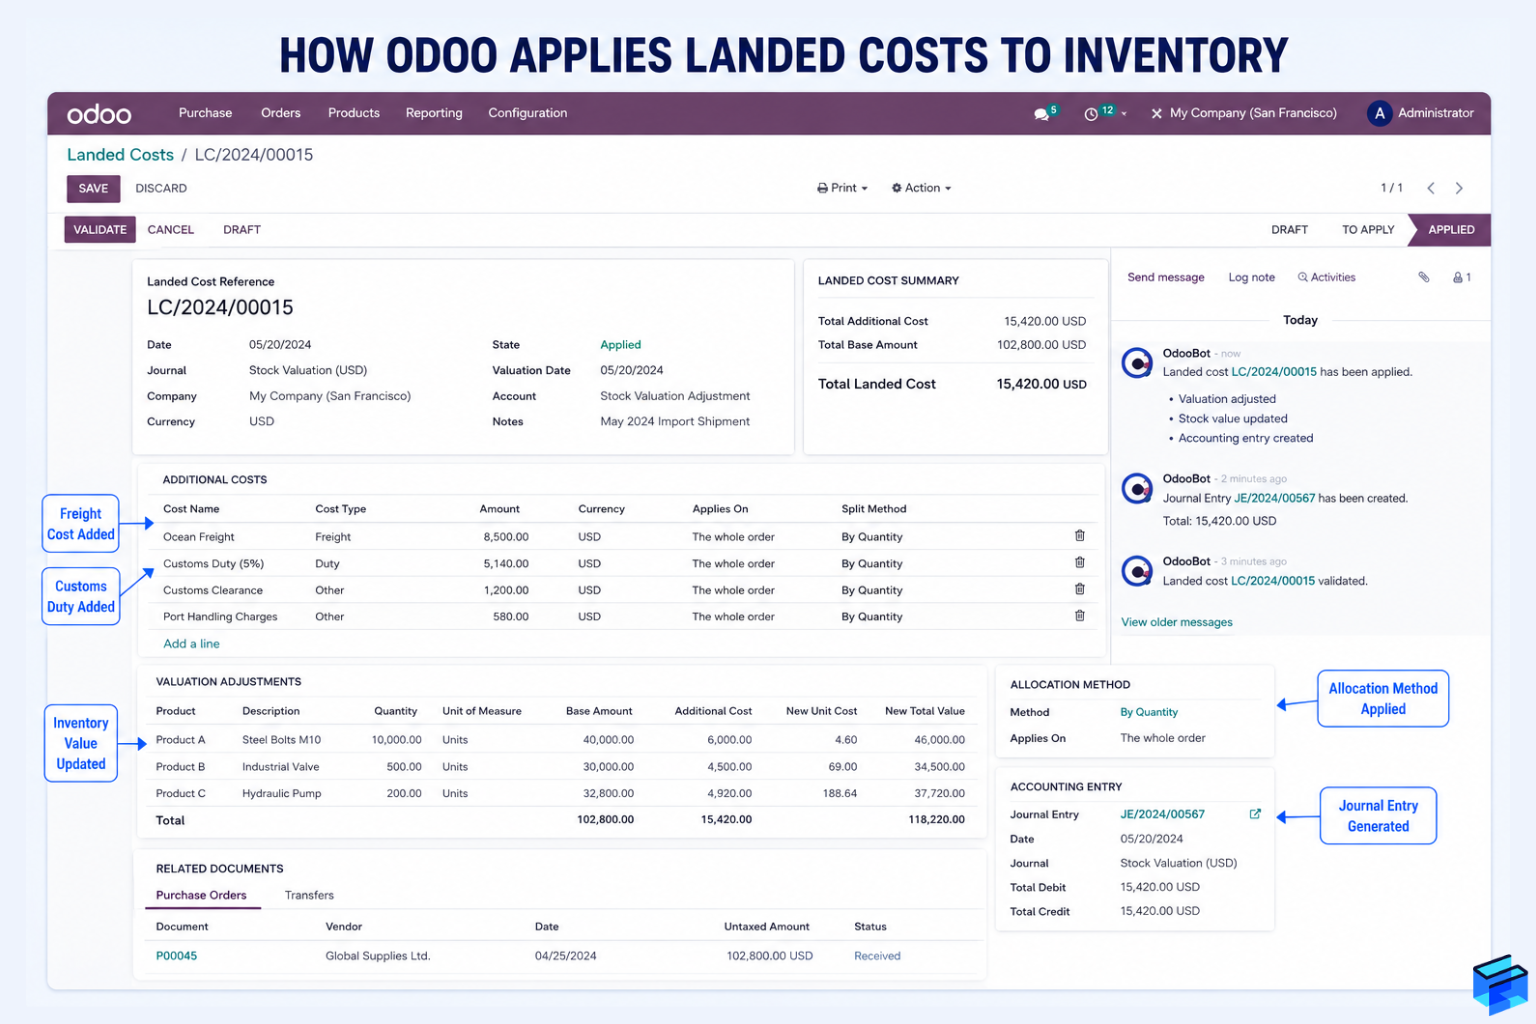
| Stage | What Odoo does | Module |
|---|---|---|
| Supplier baseline | Captures supplier quotation, PO, vendor pricing, qty, payment terms | Purchase |
| Inventory receipt | Records GRN before all costs are known; keeps inventory open for later cost additions | Inventory |
| Landed cost attachment | Attaches freight, duty, insurance, clearance, transport to specific receipts after the fact | Inventory — Landed Costs |
| Allocation | Distributes costs by qty / weight / volume / value, configurable per cost type | Inventory — Landed Costs |
| Inventory valuation | Recalculates WAC / FIFO / standard cost; posts adjustment journal entries | Inventory + Accounting |
| Variance tracking | Compares estimated vs actual; surfaces variance for review | Accounting |
| Profitability reporting | Margin by product, shipment, supplier, customer, country | Reporting |
| Documentation linkage | BOLs, COOs, COAs, insurance docs, packing lists stay attached to the transaction | Documents |
How Daily Import Cost Management Changes with Odoo
| Before | After |
|---|---|
| “What did we buy it for?” | “What did it actually cost to put this product into saleable inventory?” |
| Freight invoices reconciled at month-end | Freight invoices update inventory value as they arrive |
| Margin known only after sale | Margin visibility before pricing decisions are made |
| Customs charges in overhead accounts | Customs charges attached to inventory at receipt |
The value isn’t that Odoo can perform landed cost arithmetic. It’s that Odoo preserves the relationship between PO → shipment → additional costs → inventory value → financial impact. That relationship is what creates cost traceability — and cost traceability is what makes inventory valuation and profitability reporting trustworthy.
Track Every Import Cost Before It Becomes a Margin Problem
If your team still reconciles supplier invoices, freight bills, customs charges and inventory valuation across separate spreadsheets, you’re losing visibility somewhere between the PO and the warehouse receipt. The cost of that gap shows up later — as margin surprises, working-capital surprises, and pricing decisions made on the wrong numbers.
At Softeko, we help trading businesses design Odoo ERP workflows that connect procurement, logistics, inventory and finance into a single cost-tracking process — so management sees true landed cost, inventory value and profitability before they surface in month-end reports.
FAQ
What is import cost tracking?
Capturing, monitoring and allocating every cost associated with imported goods — from PO creation through final inventory valuation. The goal is the true landed cost rather than just supplier price.
How much of landed cost is non-supplier cost, typically?
38–42% for typical wholesale imports — freight, duties, insurance, handling, currency, payment fees.[1] The supplier-cost share grows with volume due to economies of scale.
Why do actual landed costs differ from estimated landed costs?
Estimated landed cost lets inventory valuation update before every invoice arrives; actual lands when bills are reconciled. Estimated methods enable real-time decision-making; actual methods close the variance loop.[10]
Which freight allocation method should we use?
There’s no universal answer. Quantity works for similar products, weight for bulk/chemicals, volume for lightweight goods, value for mixed-value shipments aligned with accounting. The bigger requirement is consistency — use the same method for similar shipments.
Why does inventory get undervalued by missing landed cost?
Accounting standards require inventory to be valued at the total cost incurred to bring goods to their present location and condition. When freight, duty and handling are booked as period expenses instead of inventory cost, inventory is understated, COGS is understated, and gross profit looks better than it really is — until inventory turns over and the truth surfaces.
Will Odoo automatically calculate the right landed cost?
It will allocate any cost you attach to a receipt using the rule you choose (qty / weight / volume / value). It won’t tell you which costs to attach or which method to use — those are process decisions you make first, then enforce through the system.
Why does this matter more in 2026?
73% of supply-chain leaders expect to hit a tariff-absorption wall by end-2026[3] — meaning margins can no longer absorb rising trade costs. Visibility into true landed cost is no longer optional.
References
- Ownlybrand — Factory-Direct Wholesale Pricing: Avoiding Hidden Costs (cost composition by volume) — https://ownlybrand.com/blog/factory-direct-wholesale-pricing-avoid-hidden-costs-save
- World Bank — Global Economic Prospects, Chapter 4: Freight elasticity — https://www.worldbank.org/content/dam/Worldbank/GEP/GEParchives/GEP2002/GEP2002Chap4.pdf
- TradeVerifyd — Supply Chain Statistics: Tariff Absorption Wall — https://tradeverifyd.com/resources/supply-chain-statistics
- FlexFulfillment — Fulfilment & Shipping Cost Volatility — https://www.flexfulfillment.eu/fulfilment-shipping-cost-volatility/
- InvoiceDataExtraction — Landed Cost Allocation for Manufacturing — https://invoicedataextraction.com/blog/landed-cost-allocation-manufacturing
- Oracle — Landed Cost Documentation — https://docs.oracle.com/cd/E51367_01/financialops_gs/OAEIM/F1247385AN13C24.htm
- LinkedIn — Why Landed Cost Matters for Distribution Companies — https://www.linkedin.com/pulse/why-landed-cost-matters-distribution-companies-importing-1fsxf
- Rand Group — Tariffs and Landed Costs in Dynamics 365 Business Central — https://www.randgroup.com/insights/microsoft/dynamics-365/business-central/how-to-handle-tariffs-and-landed-costs-in-dynamics-365-business-central/
- Frappe / ERPNext Community — Recording Complex Purchases — https://discuss.frappe.io/t/recording-complex-purchases/145857
- CohnReznick — Optimise Inventory Tracking with NetSuite Landed Costs — https://www.cohnreznick.com/insights/optimize-inventory-tracking-with-netsuite-landed-costs
- LinkedIn — Inventory Valuation in Bonded Zones (profit distortion) — https://www.linkedin.com/pulse/inventory-valuation-bonded-zones-avoiding-hidden-profit-distortion-hdwfc
- Microsoft Dynamics 365 Community — Import Cost Considerations Under New Tariffs — https://community.dynamics.com/blogs/post/?postid=9664346e-78d5-ee11-92bd-6045bdb22a8c
- Oracle — Global Trade Management — https://www.oracle.com/global-trade-management/
- Visco Software — ERP Customisation for Global Trade Importers (venture concept) — https://viscosoftware.com/erp-customization-global-trade-importers/
- Confiz — Simplifying Complex Import Costs with D365FO Landed Cost Module — https://www.confiz.com/blog/simplifying-complex-import-costs-how-d365fos-landed-cost-module-improves-tracking-and-control/