


Key takeaways
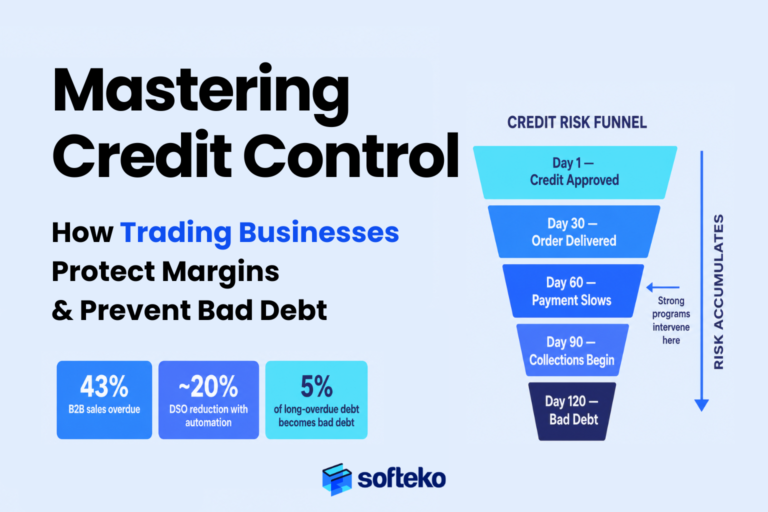
- 43% of B2B credit-based sales are overdue — mostly due to customer cash-flow pressure rather than disputes or unwillingness.[1]
- ~5% of long-overdue invoices convert into bad debt — the loss cliff escalates exponentially the longer debt ages.[1]
- Behavioral early-warning signals precede payment failure by months, not days — but most businesses don’t act on them because the visibility doesn’t exist.[2]
- Integrated AR automation delivers ~80% faster processing and ~20% DSO reduction when paired with proper governance.[3]
- Bad debt is not a collections failure. It is an upstream control failure — the cause is almost always a credit decision made months earlier.
Overview
Most trading businesses don’t lose money when a customer finally defaults. They lose money much earlier.
The loss begins the day a credit limit is approved without proper review. It begins when a salesperson extends payment terms to secure a deal. It begins when management makes an exception for a large customer without evaluating total exposure. By the time an invoice reaches 90 or 120 days overdue, the damage has often been accumulating for months.
This is why many finance teams spend enormous effort on collections but see little improvement in bad-debt performance. They’re treating the symptom, not controlling the cause.
Credit control is not an accounts-receivable activity. It is an operational control system that governs how much risk your business is willing to accept.
This article covers:
- Why trust-based selling creates hidden financial risk
- How customer credit exposure grows without anyone noticing
- The 4 warning signs your credit-control process is breaking down
- The Customer Risk Escalation Model — where to intervene
- Why most collection problems start before the invoice is sent
- The Credit Protection Framework — 6 operational controls
- How Odoo turns credit policy into enforced operational discipline
- A 30-question self-assessment scorecard
- FAQ
Why Trust-Based Credit Decisions Increase Bad Debt Risk
Most credit problems don’t begin with a missed payment. They begin with a successful sale to a customer everyone trusts.
The customer has bought for years. Previous transactions completed without issues. The order looks safe. Credit approval becomes a formality. No one believes risk exists.
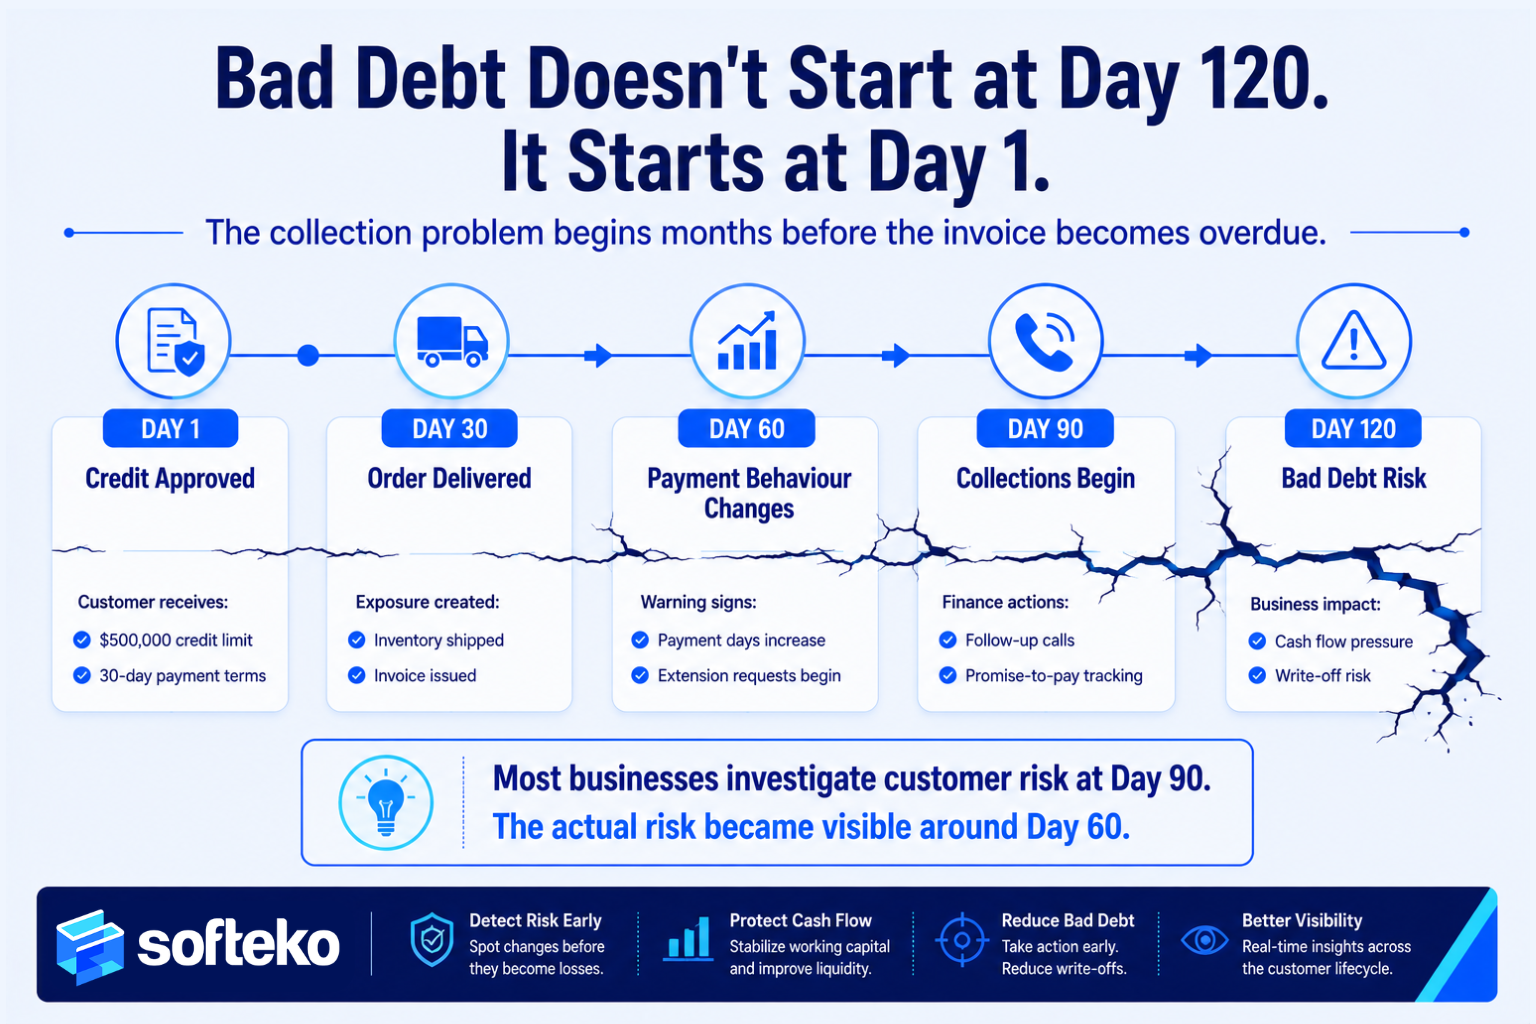
Then market conditions change. The customer’s own customers pay later. Their cash flow tightens. Invoices that were paid in 30 days reach 60, then 90, then 120. Finance starts chasing collections. The actual mistake happened months earlier — credit was extended based on trust instead of current risk assessment.
This works at low scale. With 20 customers, management personally knows everyone. Warning signs are visible. Informal conversations surface issues early. With 200 customers, trust becomes dangerous — relationships fragment, individual employees see only part of the picture, and exposure accumulates in the gaps.
CRF research from 2024 is direct on this: behavioral early-warning signals (operational changes, payment-velocity shifts, staff turnover at the customer, facility moves) precede payment failure by months, not days.[2] The data exists. Most businesses just can’t see it in one place.
Three Credit Assumptions That Increase Bad Debt Risk
| Assumption | Why it fails |
|---|---|
| “They have always paid before” | Customer risk is dynamic. Five years of clean payment history doesn’t insulate against a quarter of market stress. |
| “They are too important to challenge” | Exceptions for major customers grow exposure faster than management realises. A 15-20% revenue concentration becomes a 15-20% liquidity risk. |
| “Collections will fix it” | Collections can only recover what’s still recoverable. It can’t reverse poor credit decisions or untrap working capital. |
Why Overdue Invoices Do Not Show Customer Risk Early
Most organisations measure credit health using aging reports — 30, 60, 90, 120 days overdue. Those reports are important, but they’re backward-looking. An overdue invoice tells you a problem already exists. It doesn’t tell you when the risk began.
| Month | Customer’s average payment days |
|---|---|
| January | 28 days |
| February | 34 days |
| March | 42 days |
| April | 53 days |
| May | 68 days |
| June | 89 days |
ost businesses don’t react until June. The risk actually became visible in February. By June, exposure has accumulated across multiple orders. As Moody’s puts it: bad debt is rarely a failure of data — it’s a failure of visibility.[4] Businesses have the signals; they just can’t act on them.
This is why experienced credit controllers monitor behavioral trends, not just overdue balances. Payment behavior deteriorates long before invoices become technically delinquent.
How Credit Exposure Grows Without Anyone Noticing
Growth often makes risk worse, not better. As revenue grows, customer exposure grows faster — and if payment performance simultaneously deteriorates, exposure compounds.
| Scenario | Monthly revenue | Payment days | Avg outstanding |
|---|---|---|---|
| Baseline | $500K | 30 days | ~$500K |
| Revenue doubles | $1.0M | 30 days | ~$1.0M |
| Revenue doubles + payment slows | $1.0M | 60 days | ~$2.0M |
That’s a 4× increase in exposure from a 2× revenue gain. Revenue looks great. Liquidity quietly suffers.
Why Low Overdue Balances Can Hide High Credit Risk
A surprisingly large number of high-risk customers show zero overdue on the aging report:
| Metric | Customer A |
|---|---|
| Credit limit | $500,000 |
| Outstanding balance | $480,000 |
| Overdue amount | $0 |
| Payment status | Current |
Most dashboards mark this account healthy. A risk-focused review reaches a different conclusion: one delayed payment immediately breaches the limit; one business shock pushes the account into a major collection challenge. The account looks compliant. The underlying exposure is dangerous.
This is why mature credit programs measure total exposure, not just overdue balances:
- Outstanding balance
- Available credit
- Payment behavior trends
- Industry risk
- Customer concentration
- Order pipeline exposure
- Historical exception frequency
4 Warning Signs Your Credit Control Is Breaking Down
| # | Warning sign | What it looks like | Real problem |
|---|---|---|---|
| 1 | Credit exceptions becoming routine | Override requests rise from “rare” to “weekly” | Governance gap — approved limits become reference numbers |
| 2 | Payment trends worsening, aging reports look fine | Avg payment days drift up 5-10 days per quarter | Most teams react only at formal aging thresholds |
| 3 | Sales and Finance operating from different realities | Sales sees opportunity; Finance sees exposure; neither sees both | Decisions made on partial data |
| 4 | Collections start only when invoices reach 60-90 days | Customer learns late payment has no immediate consequence | The business has accidentally trained the customer |
Who Is Responsible for Customer Credit Risk?
Finance assumes Sales understands customer conditions. Sales assumes Finance is monitoring exposure. Management assumes existing policies are followed. Meanwhile, exposure grows in the gap between departments.
Credit Control Self-Check
- Are credit-limit overrides becoming more frequent?
- Are customers paying later than 6 months ago?
- Are overdue invoices increasing despite strong sales growth?
- Do Sales and Finance disagree about customer risk?
- Are collection efforts primarily reactive?
- Are customer reviews performed only when problems occur?
- Are large customers receiving undocumented exceptions?
- Are management overrides difficult to track historically?
How Customer Credit Risk Increases Over Time
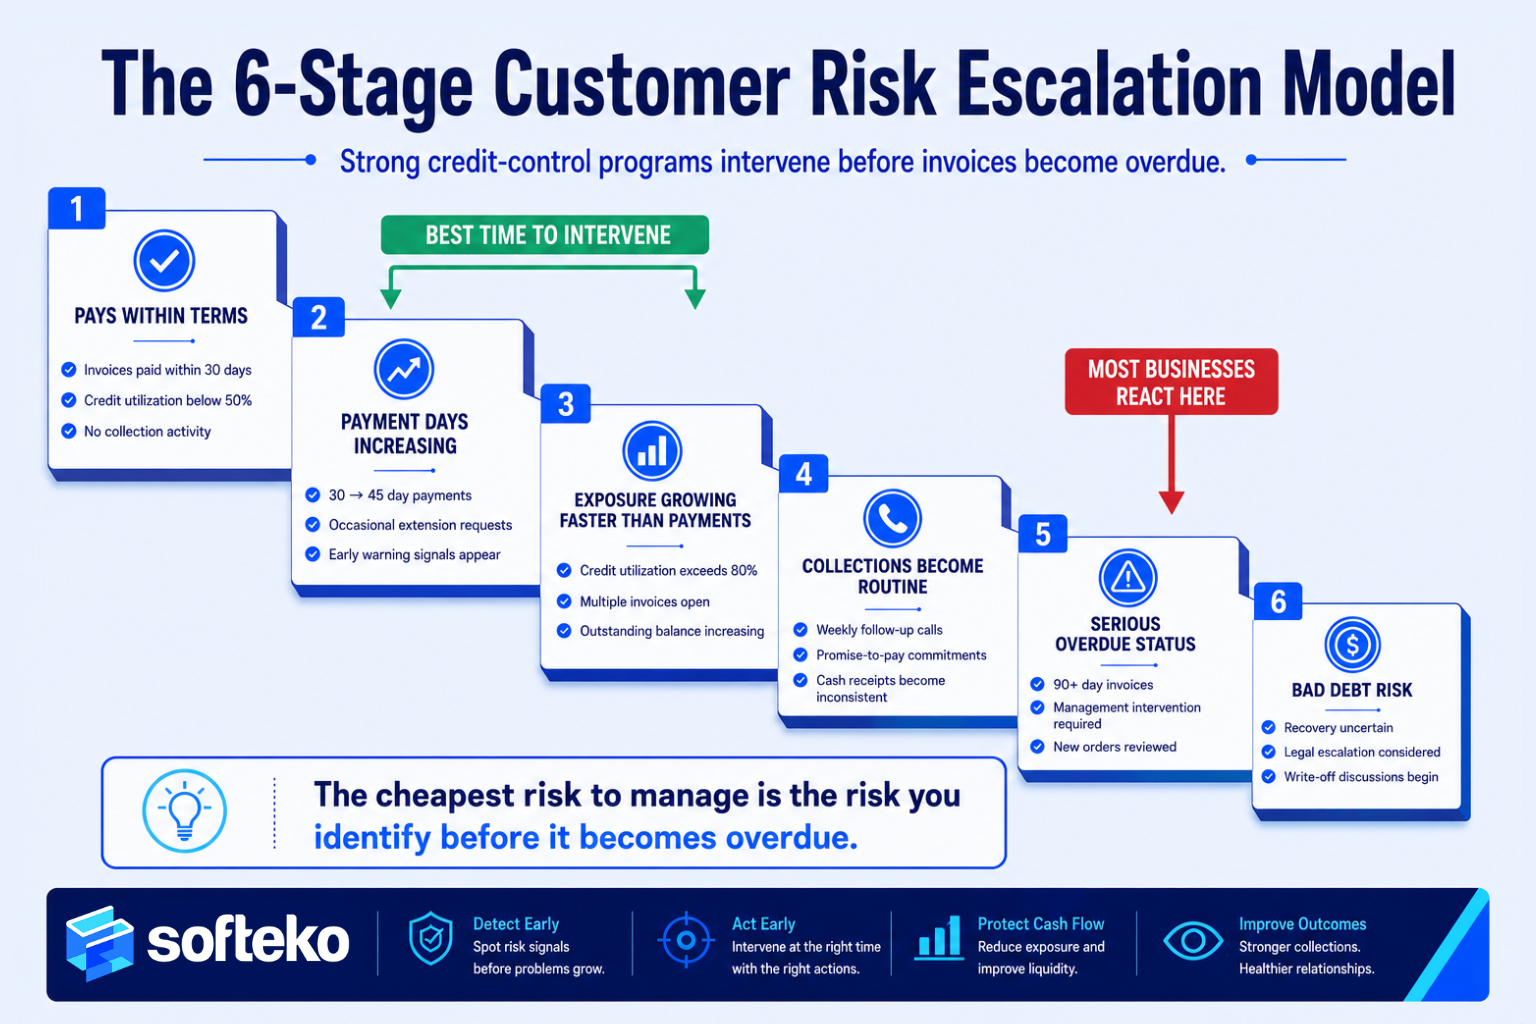
Customer credit risk is a progression, not an event. The cheapest stage to intervene is Stage 2 or 3. Most organisations focus on Stage 5 or 6, where intervention is least effective.
| Stage | Status | Indicators | Where most firms react |
|---|---|---|---|
| 1 | Stable customer | Pays within terms, low exception frequency, predictable purchasing | Status quo |
| 2 | Behavioral drift | Small payment delays, extension requests, credit utilisation rising | ← Strong programs intervene here |
| 3 | Exposure expansion | Larger orders requested, credit-limit increases, multiple invoices open | ← Strong programs also intervene here |
| 4 | Collection dependence | Follow-up calls routine, promises replace payments, inconsistent cash | Where most firms first notice |
| 5 | Escalation | Serious overdue balances, management intervention required | Where most firms react |
| 6 | Bad debt risk | Recovery uncertain, legal action considered, write-off discussions | Where it’s too late to prevent |
Why Most Collection Problems Start Before the Invoice
When an invoice hits 90 days overdue, most organisations launch a collections investigation. They’re investigating the wrong stage. The collections team is inheriting a problem that was created upstream — at credit approval, exception handling, exposure monitoring, or order release.
Five Process Failures That Lead to Bad Debt
| # | Root cause | Why it produces bad debt |
|---|---|---|
| 1 | Weak customer evaluation | Onboarding is rigorous, but customers are never re-assessed. Risk profile that was true 2 years ago is treated as still true today |
| 2 | Credit limits based on revenue, not risk | “How big a customer could they be?” replaces “How much exposure can we safely carry?” |
| 3 | Payment terms used as sales incentives | 30 → 45 → 60 → 90. Each adjustment looks minor; cumulatively, working-capital requirement transforms |
| 4 | No exposure visibility across departments | Sales sees opportunities, Finance sees outstanding balances, Operations sees order commitments. No one sees combined picture |
| 5 | No defined escalation path | Some overdue accounts get aggressive follow-up; others get extensions; inconsistency creates risk |
How Bad Debt Develops Step by Step
| What businesses imagine | What actually happens |
|---|---|
| Invoice → Overdue → Collection problem → Bad debt | Weak evaluation → Excessive exposure → Credit exceptions → Deteriorating payment behaviour → Delayed collections → Severe overdue → Potential bad debt |
Collections appears near the end of the actual sequence. That’s why overdue invoices are lagging indicators — the real causes emerged months earlier.
Why Long-Term Customers Can Become High-Risk Customers
Across many trading operations, the highest-risk accounts are often the longest-standing ones, not new customers. Trust gradually replaces discipline. Controls relax. Exceptions become easier. Reviews become less frequent. The exposure was never invisible — it just stopped being questioned.
Credit control vs Collections
| Collections | Credit control |
|---|---|
| Focuses on overdue invoices | Focuses on exposure management |
| Reacts to payment delays | Prevents excessive risk |
| Starts after invoicing | Starts before order approval |
| Measures recovery performance | Measures risk prevention |
| Works on existing problems | Works on future problems |
Many organisations invest heavily in collections while leaving customer-risk decisions largely uncontrolled. That creates an endless cycle: exposure rises, invoices age, collections intensify, temporary improvement, exposure rises again. Nothing fundamentally changes.
Six Credit Controls That Prevent Bad Debt
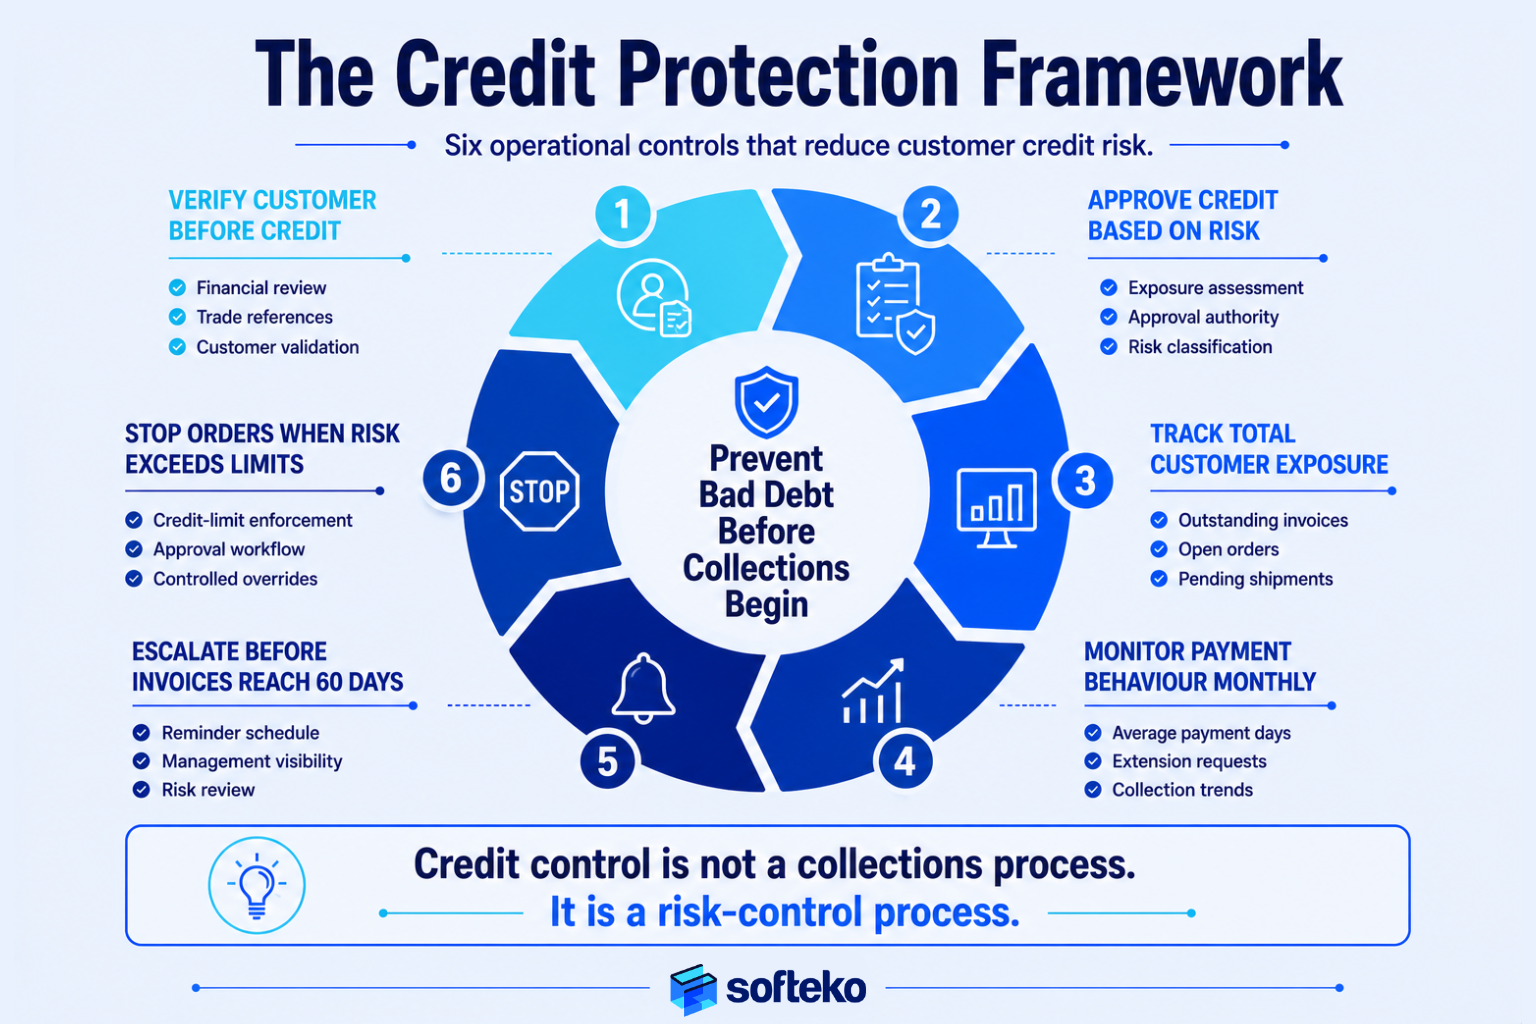
A practical credit-control system should manage risk across the entire customer lifecycle, not just after problems appear.
| # | Control | Purpose |
|---|---|---|
| 1 | Customer qualification | Structured risk assessment before credit is extended — legal/compliance, financial review, industry risk, payment history, trade references |
| 2 | Credit approval governance | Authority tiered by exposure level: low risk → Finance Manager; medium → Finance Director; high → CFO; exceptions → Executive |
| 3 | Exposure monitoring | Outstanding invoices + open orders + pending shipments + approved credit extensions + future commitments |
| 4 | Payment behaviour analysis | Avg payment days, trend changes, extension request frequency, dispute frequency, promise-to-pay reliability |
| 5 | Escalation discipline | Risk triggers predefined actions, not subjective decisions |
| 6 | Risk-based order release | Order release linked to customer risk status — doesn’t reject business, makes acceptance conscious |
Escalation Events and Standard Actions
| Event | Standard action |
|---|---|
| Due date approaching | Reminder sent |
| 7 days late | Collection follow-up |
| 15 days late | Management visibility |
| 30 days late | Credit review |
| 45+ days late | Order restriction review |
| 60+ days late | Formal escalation process |
| Credit utilisation >80% | Finance review |
| Repeated exceptions | Credit committee review |
Academic research on receivables management makes a critical operational point: DSO alone is insufficient.[5] During high-growth periods, DSO can look stable while actual collection efficiency deteriorates. Collection Effectiveness Index (CEI) is a more accurate measure because it isolates collection performance from sales volume. High-performing teams track both.
Why Credit Control Policies Often Fail
Implementing controls isn’t the hard part. Enforcing them is. The failure patterns are predictable:
- Sales pressure overrides policy (revenue targets > credit discipline)
- Credit reviews become administrative box-ticking
- Risk ownership becomes unclear (Sales/Finance/Management each assume someone else owns it)
- Historical exceptions are forgotten; future decisions inherit outdated assumptions
How Sales and Finance Should Approve Credit Exceptions
The Sales-vs-Finance conflict is built into the business model, not caused by communication problems:
| Sales is rewarded for | Finance is responsible for |
|---|---|
| Revenue growth | Cash collection |
| Market expansion | Working-capital protection |
| Customer retention | Credit exposure |
| Volume achievement | Risk control |
The same customer therefore looks completely different depending on who evaluates them. The fix isn’t to ban overrides — it’s to control them.
When Credit Exceptions Should Be Approved
| Commercial value | Risk level | Recommended action |
|---|---|---|
| High | Low | Approve |
| High | Medium | Controlled approval |
| High | High | Executive review |
| Low | High | Reject |
| Low | Medium | Reassess |
| Low | Low | Standard approval |
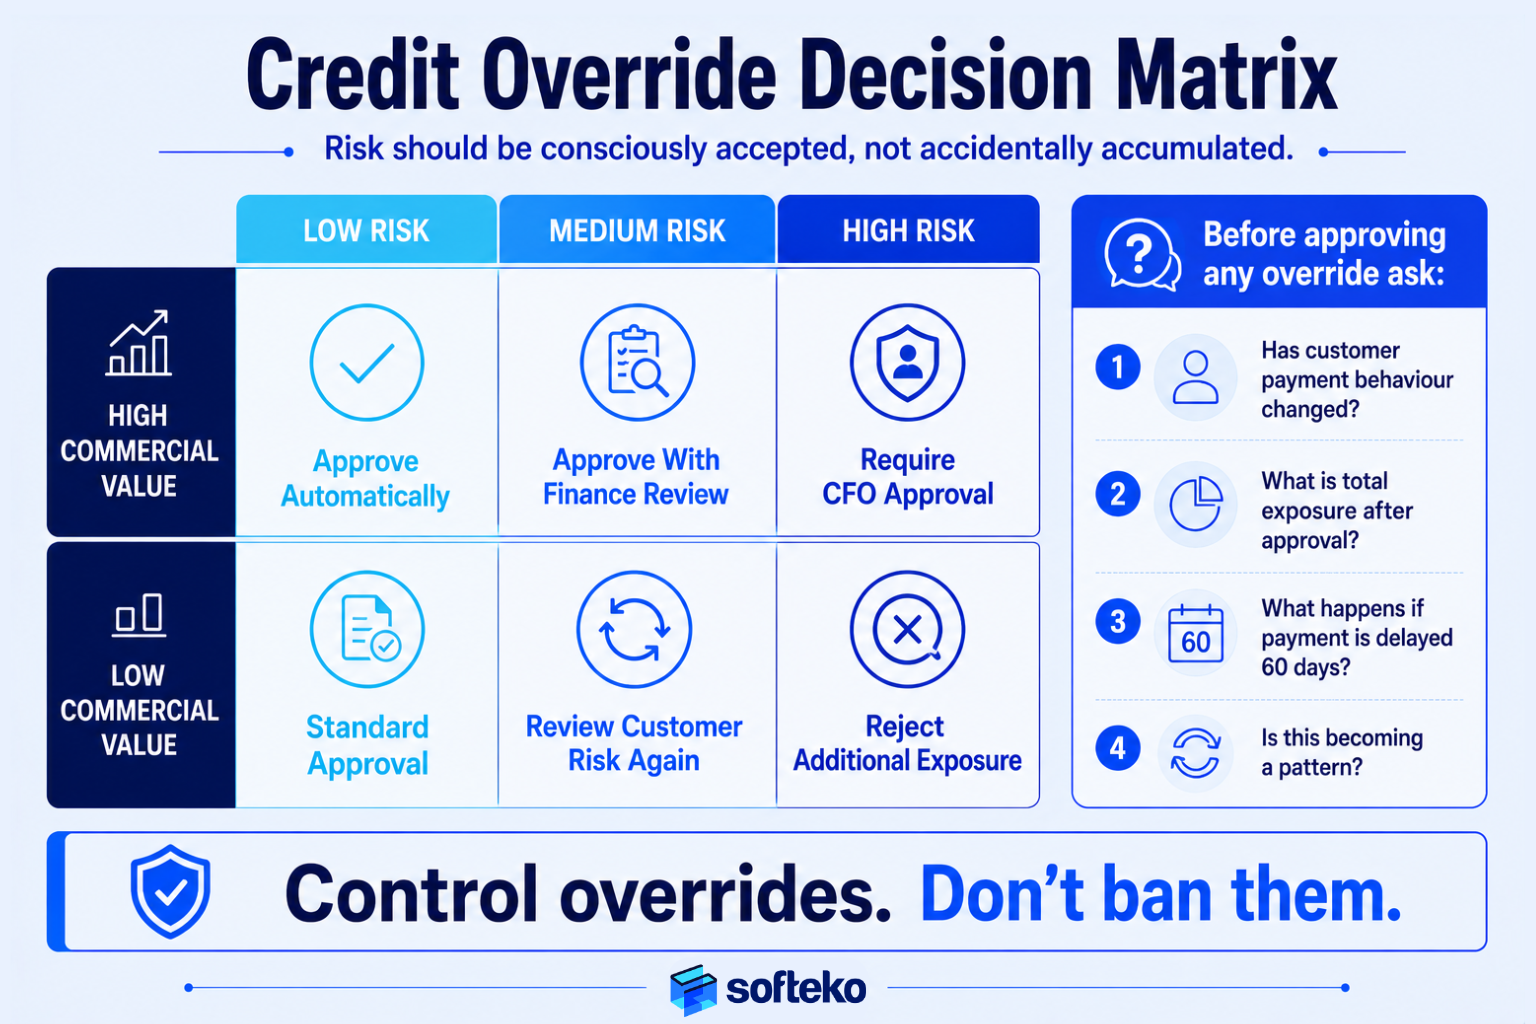
The key principle: risk should be consciously accepted, not accidentally accumulated.
Four Questions Before Approving a Credit Exception
- Has customer risk changed since last review?
- What is total exposure after this approval?
- What happens if payment is delayed by 60 days?
- Is this becoming a pattern?
One-time exceptions can be reasonable. Repeated exceptions indicate a broken process.
How Odoo Helps Enforce Your Credit Control Process
Most businesses don’t struggle with credit policy — they struggle with enforcing it. As transaction volume grows, manual control becomes unreliable. Policies live in spreadsheets, emails, and individual judgment. Different departments operate from different data.
Odoo turns the 6 controls from the framework into the default path of work — not by replacing judgment, but by making information visible and approvals consistent.
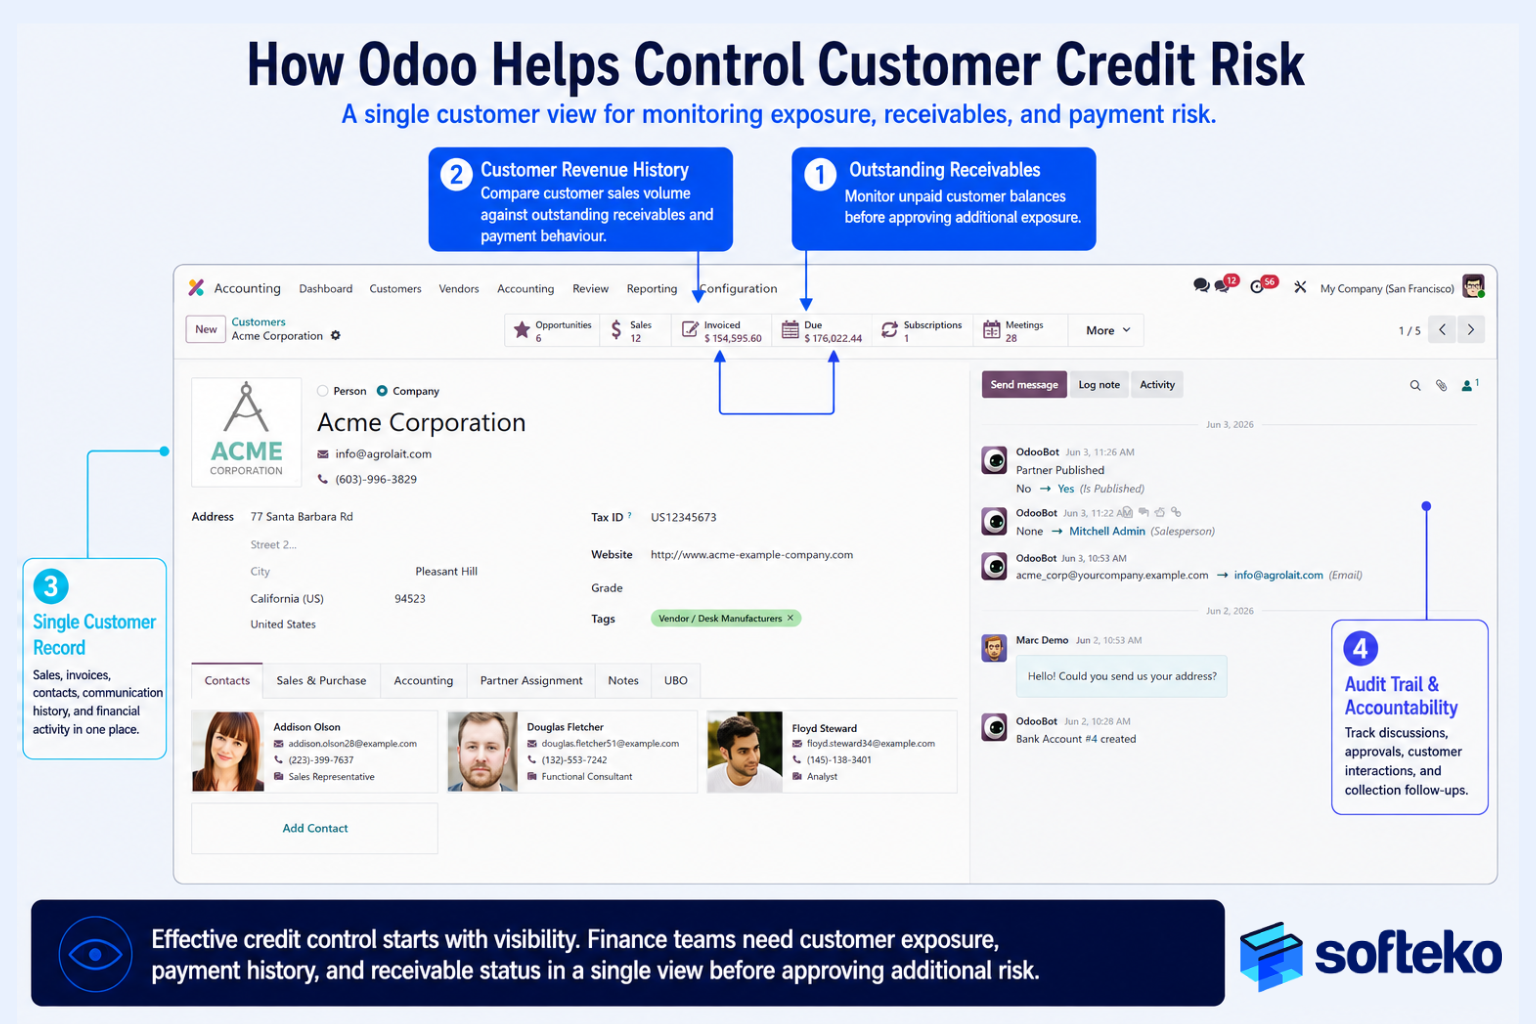
| Control | Odoo capability | Module |
|---|---|---|
| Centralised customer risk visibility | Customer profile + credit limit + outstanding + overdue + payment history + open orders in one record | Contacts + Accounting + Sales |
| Automated credit-limit enforcement | Warnings, blocks, or approval routing triggered when limit breached | Sales + Accounting |
| Structured approval workflows | Multi-step approvals for credit increases, term extensions, margin exceptions | Approvals + Studio |
| Continuous exposure monitoring | Real-time exposure dashboards (not weekly reports) | Accounting |
| Escalation automation | Automated reminders, follow-up tasks, management alerts at predefined thresholds | Accounting (Follow-ups) |
| Management visibility | Total exposure, customer concentration, high-risk accounts, aging trends, CEI | Reporting |
A worked example of recent AR automation analysis showed integrated AR automation delivers ~80% faster processing and ~20% DSO reduction — but only when paired with governance discipline.[3] Billtrust’s analysis on AR automation ROI reaches the same conclusion: manual review and approval cycles manifest as “revenue leaks” because risk materialises before the review happens.[6]
What ERP cannot fix: clear credit policies, defined approval authority, regular customer reviews, management discipline, cross-functional accountability. A weak process inside ERP remains a weak process. Technology amplifies governance; it does not replace governance.
Build a Credit Control Process That Prevents Bad Debt
If your finance team spends most of its time chasing overdue invoices, negotiating extensions, and approving “one-time” exceptions — the problem usually isn’t collections. It’s the absence of structured credit control upstream.
At Softeko, we help trading, wholesale, distribution and import-export businesses build Odoo ERP environments that enforce credit-control discipline across Sales, Finance and Operations — so customer risk becomes visible before exposure becomes uncomfortable.
The objective isn’t more software. It’s structured, auditable, enforceable governance over how much customer risk your business consciously accepts.
FAQ
Is bad debt a collections problem or a credit-control problem?
Almost always upstream. By the time collections engages, exposure has already accumulated through credit-approval decisions, payment-term extensions, and unmanaged exposure growth — usually months earlier.
What is the most reliable early-warning signal of customer payment risk?
Payment velocity trend, not overdue status. CRF research consistently finds that average-payment-days drift precedes overdue events by months. Combined behavioral signals (extension requests, dispute frequency, partial payments) improve early-stage detection by months, not days.[2]
What % of B2B credit sales are typically overdue?
~43% in North America, primarily due to customer cash-flow pressure rather than disputes or unwillingness — per Atradius 2025 Payment Practices Trends.[1]
How quickly does overdue debt convert to bad debt?
Atradius data shows roughly 5% of long-overdue invoices become unrecoverable bad debts — and the risk escalates exponentially the longer debt ages. The focus should be preventing debt from reaching “long overdue” in the first place.
Why isn’t DSO enough to measure collection effectiveness?
DSO can look stable during high-growth periods while actual collection performance deteriorates — because rising sales mask aging receivables. Collection Effectiveness Index (CEI) isolates collection performance from sales volume and is a more accurate measure.[5]
Should sales teams be allowed to override credit rules?
Yes — but not independently, informally, or invisibly. Use a controlled override matrix tied to risk level and commercial value, with documented approval authority. Risk should be consciously accepted, not accidentally accumulated.
Will Odoo prevent bad debt automatically?
No system prevents bad debt. Odoo enforces the controls that prevent it — visibility into exposure, automated approval routing, escalation rules, standardised reminders, audit trails on exceptions. The decisions still require human judgment; the system makes them consistent.
What’s the difference between credit control and collections?
Collections focuses on overdue invoices and recovery. Credit control focuses on exposure management and risk prevention. Strong businesses invest in both — but credit control is what reduces how many invoices ever need to be collected.
References
- Atradius — B2B Payment Practices Trends in North America 2025 (43% overdue; 5% bad-debt conversion) — https://group.atradius.com/knowledge-and-research/reports/b2b-payment-practices-trends-in-north-america-2025
- Credit Research Foundation — Perspective Q2 2024 (behavioral early-warning signals) — https://www.crfonline.org/wp-content/uploads/2024/06/Perspective-Q2-2024_NonMbr_rd.pdf
- Fortis — The Hidden Cost of Fragmented AR Workflows (80% faster processing, 20% DSO reduction) — https://fortispay.com/the-hidden-cost-of-fragmented-ar-workflows-what-tech-leaders-should-know/
- Moody’s — Credit Risk: Miss the Signals, Pay the Price — https://www.moodys.com/web/en/us/insights/banking/credit-risk-miss-the-signals-pay-the-price.html
- Receivable Management Performance Tool (Academia.edu) — DSO vs CEI: Why Collection Effectiveness Index Is More Accurate — https://www.academia.edu/download/94406270/ART20177072.pdf
- Billtrust — ROI of Accounts Receivable Automation (manual review as “revenue leak”) — https://www.billtrust.com/resources/blog/roi-of-accounts-receivable-automation