


Key takeaways
- €1.84 trillion of excess working capital sits trapped globally — with €300 billion of it in elevated stockpiles across Western markets (PwC Working Capital Study 25/26, based on ~17,000 companies).
- DSO has risen from 47.3 days (2015) to 50.0 days (2024) — a +5.7% increase in how long customers take to pay across company sizes and regions (PwC).
- Six in 10 treasurers say their cash-flow forecast contains “significant” or “major” inaccuracies (Kyriba survey via HighRadius).
- Finance teams spend ~30% of their time reconciling data between disconnected systems instead of analysing it (BlueCopa).
- The fix isn’t more reports. It’s connecting sales, inventory, procurement, receivables, and payables in one system so future cash position is visible before liquidity tightens.
Overview
A trading business can report strong sales growth, healthy gross margins, and a profitable year-end — and still struggle to pay suppliers on time.
At first glance that looks like a finance problem. In practice it almost always starts much earlier. A large customer order extends receivable days. Procurement places bulk purchases to secure pricing. Inventory arrives weeks before payment is collected. Multiple departments make reasonable decisions in isolation, but nobody sees the combined impact on cash.
The result is familiar: revenue grows, inventory grows, receivables grow, cash availability shrinks.
Cash flow visibility is not the ability to view today’s bank balance. Most finance teams have that. The harder problem is understanding what cash will look like in 30, 60, or 90 days — a question that depends almost entirely on operational activity nobody is tracking centrally.
This article covers:
- What cash flow visibility actually means (and why most teams think they have it when they don’t)
- The Cash Conversion Cycle and why it matters
- The 7 operational drivers of cash-flow problems
- Why financial reports alone can’t predict liquidity stress
- The Working Capital Visibility Framework — 6 layers
- How Odoo turns those 6 layers into a single working-capital view
- FAQ + a starting audit
Related reading in this series: the inventory-led version of this argument is in Why Inventory Keeps Growing While Cash Flow Gets Worse. This post is the visibility-led companion — what to do when your inventory is fine but you still can’t see what cash is about to do.
What cash flow visibility means
Most management teams believe they have cash-flow visibility because they receive monthly reports. They can see bank balances, P&L statements, receivables and payables aging. None of those explain what cash will look like six weeks from now.
Cash flow visibility is not the ability to explain where cash went. It is the ability to anticipate where cash is going.
A business with strong visibility can answer the operational questions before they become financial problems:
- Which customers are expected to pay late?
- Which purchase commitments will require cash next month?
- How much inventory is tying up working capital right now?
- Which sales orders are likely to convert into collections?
- Which supplier payments will create liquidity pressure?
- What happens to cash if sales grow 20% next quarter?
Why Management Still Misses Future Cash Flow
The information almost always exists — it’s just scattered. Sales knows future demand. Procurement knows future purchasing commitments. Warehouse knows inventory. Finance knows receivables and payables. Management gets fragments.
BlueCopa frames it bluntly: “Working capital decisions made on three-week-old data aren’t decisions — they’re guesses.” And PwC’s analysis confirms the cost: finance teams spend roughly 30% of their time collecting and reconciling data between systems rather than analysing it.
This is fundamentally a working-capital management capability, not an accounting function. Working capital has three moving parts:
| Working capital component | When it grows | Impact on cash |
|---|---|---|
| Accounts Receivable (AR) | Sales extend credit, customers pay slowly | Cash trapped with customers |
| Inventory | Procurement overbuys, demand softens, stock ages | Cash trapped on warehouse shelves |
| Accounts Payable (AP) | Supplier terms tighten, early payments made | Cash leaves the business sooner |
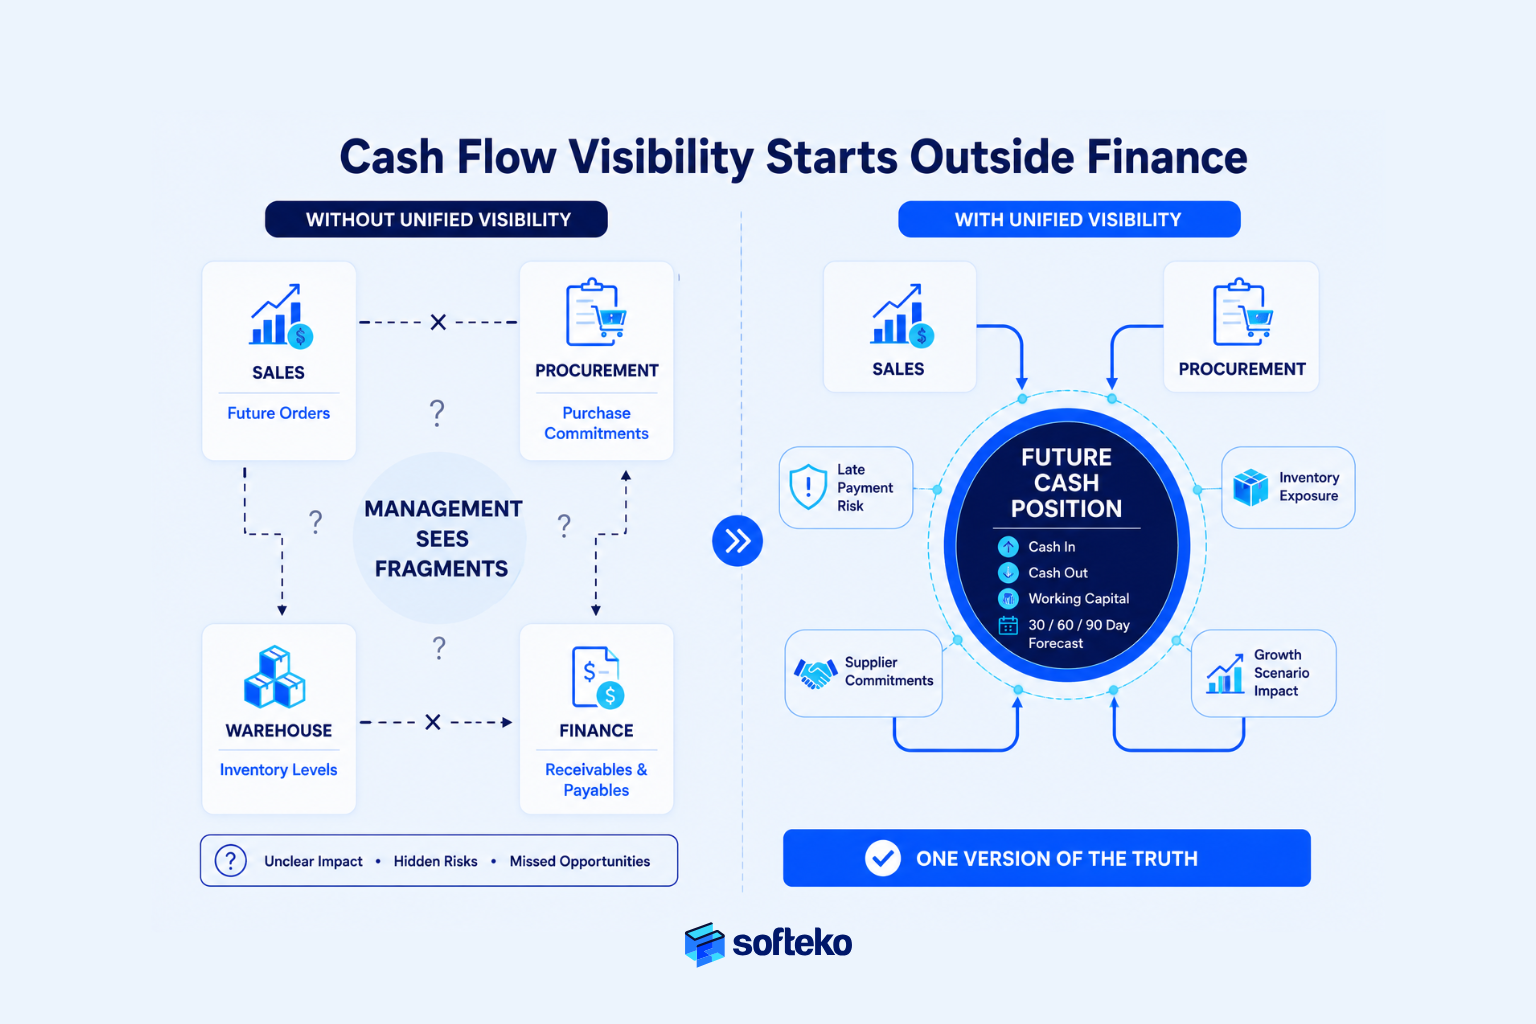
The drivers of all three sit outside finance — in sales, procurement, and warehouse decisions. Finance just records the consequences. As Bain’s working-capital research notes: “Employees at all levels make daily business decisions that impact the cash conversion cycle, so any sustained improvement requires cross-functional cooperation and an organization-wide focus on cash.”
How the Cash Conversion Cycle Affects Cash Flow
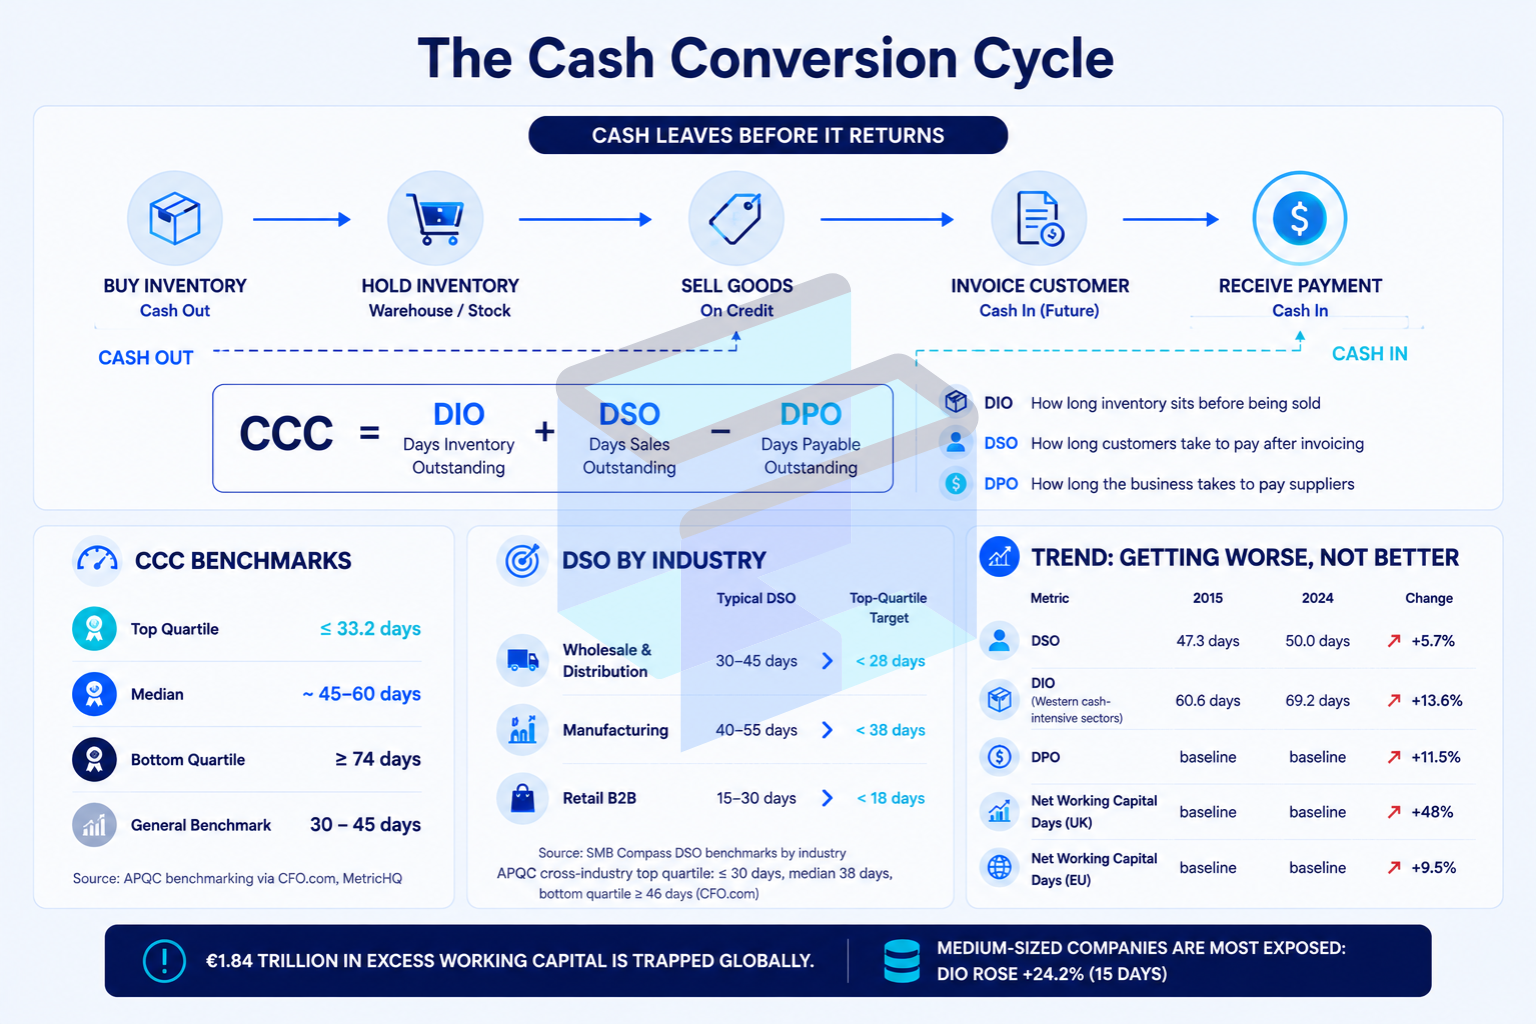
Every trading business follows the same financial reality: cash leaves the business before cash returns. The period between those events is the Cash Conversion Cycle (CCC):
CCC = DIO + DSO − DPO
| Component | What it measures |
|---|---|
| Days Inventory Outstanding (DIO) | How long inventory sits before being sold |
| Days Sales Outstanding (DSO) | How long customers take to pay after invoicing |
| Days Payable Outstanding (DPO) | How long the business takes to pay suppliers |
The longer the cycle, the more working capital the business has to finance. Two businesses with identical revenue can have completely different liquidity positions purely because their cycles run at different speeds.
CCC (Cash Conversion Cycle) benchmarks
| Performer tier | CCC (days) |
|---|---|
| Top quartile | ≤33.2 days |
| Median | ~45–60 days |
| Bottom quartile | ≥74 days |
| General benchmark range | 30–45 days |
Source: APQC benchmarking via CFO.com, MetricHQ
Average DSO Benchmarks by Industry
| Industry | Typical DSO | Top-quartile target |
|---|---|---|
| Wholesale & Distribution | 30–45 days | Below 28 days |
| Manufacturing | 40–55 days | Below 38 days |
| Retail B2B | 15–30 days | Below 18 days |
Source: SMB Compass DSO benchmarks by industry. APQC also reports the cross-industry top quartile at ≤30 days, median 38 days, bottom quartile ≥46 days (CFO.com).
DSO, DIO, and DPO Are Increasing
PwC’s 2025/26 Working Capital Study of ~17,000 companies shows the structural picture:
| Metric | 2015 | 2024 | Change |
|---|---|---|---|
| DSO | 47.3 days | 50.0 days | +5.7% |
| DIO (Western cash-intensive sectors) | 60.6 days | 69.2 days | +13.6% |
| DPO | baseline | baseline | +11.5% (suppliers being stretched — unsustainable) |
| Net Working Capital Days (UK) | baseline | baseline | +48% |
| Net Working Capital Days (EU) | baseline | baseline | +9.5% |
PwC’s headline conclusion: €1.84 trillion in excess working capital is trapped globally, much of it in inventory that companies built up as a hedge against supply-chain disruption. Their phrase for the shift is striking: “from just-in-time to just-in-case to just-because stocking.” €300 billion sits in elevated stockpiles in Western markets alone.
The most exposed group: medium-sized companies, where DIO rose +24.2% (15 days), compared to +5.5% at large companies and +11.5% at smaller ones.
7 Operational Causes of Cash Flow Problems
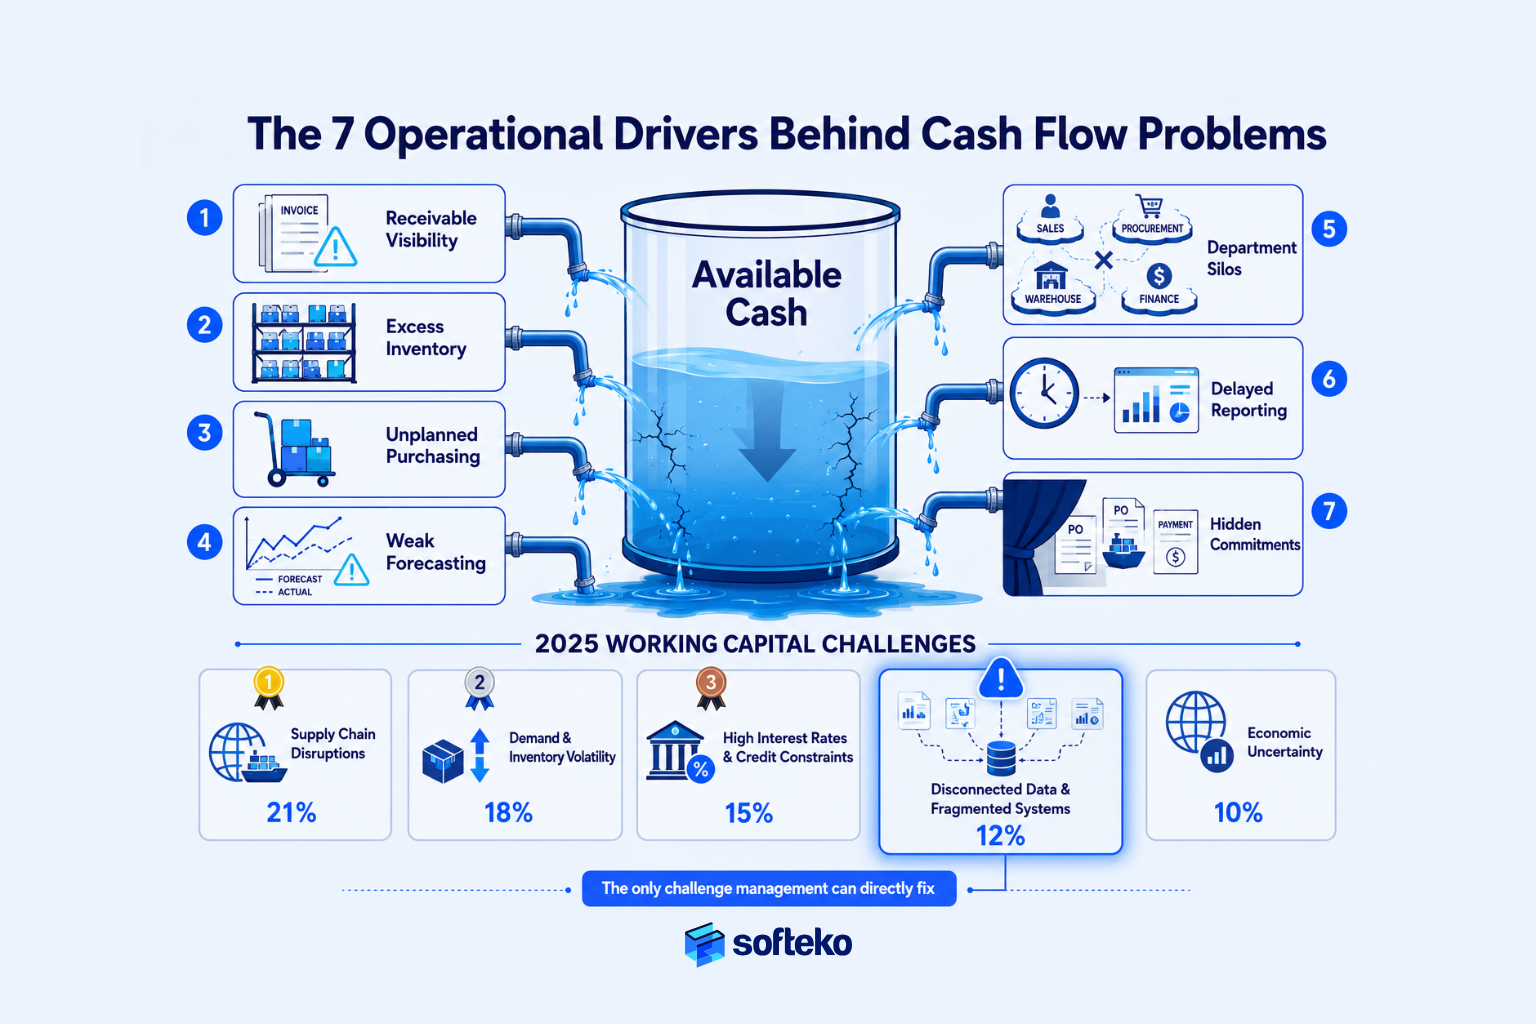
When liquidity tightens, management often looks at finance first — bank balances, overdue receivables, slowing supplier payments. Those actions provide temporary relief but rarely address the cause. In most trading businesses, cash-flow problems originate much earlier.
| # | Driver | What it looks like | Where it originates |
|---|---|---|---|
| 1 | Poor receivable visibility | Customers within credit limit but showing late warning signs (partial payments, repeated promises, disputes) | Sales + Finance silo |
| 2 | Excess inventory investment | Warehouse “looks productive” while cash trapped on shelves; ~12% dead stock typical | Procurement, warehouse |
| 3 | Unplanned purchasing decisions | Bulk discount accepted without checking the cash-tie-up cost | Procurement |
| 4 | Weak demand forecasting | Procurement buys against optimistic forecasts; orders don’t materialise | Sales + planning |
| 5 | Departmental decisions without shared visibility | Each function optimises locally; combined effect = working-capital burden | Cross-functional |
| 6 | Delayed reporting | Reports surface issues after inventory was bought, credit extended, suppliers committed | Reporting cadence |
| 7 | Hidden future commitments | Approved POs, incoming shipments, planned supplier payments don’t show in current cash reports | Process / system gap |
The common thread across all seven: no one can see the full working-capital picture in one place. Receivables sit in one report, inventory in another, payables elsewhere, purchase commitments in spreadsheets, sales forecasts in separate files. By the time leadership manually combines the information, the situation has already moved.
Why Business Growth Can Increase Cash Pressure
Most executives expect rising revenue to improve liquidity. Operationally, the opposite often happens. Recent analysis on revenue-induced financial stress and LinkedIn working-capital research describe the same pattern: when sales rise but cash pressure rises faster, the problem isn’t revenue — it’s a financial system that hasn’t scaled with operational complexity. Growth requires more inventory, more freight commitment, more supplier deposits, longer receivable balances, higher credit exposure. Cash leaves before it returns, and the faster growth happens, the larger the working-capital requirement.
Top Working Capital Challenges in 2026
GSCF’s 2025 survey ranks what trading and distribution leaders cite as their biggest pressures right now:
| Rank | Challenge | % of companies |
|---|---|---|
| 1 | Supply chain disruptions | 21% |
| 2 | Shifting customer demand & inventory levels | 18% |
| 3 | High interest rates & credit constraints | 15% |
| 4 | Disconnected data & fragmented systems | 12% |
| 5 | Geopolitical & economic uncertainty | 10% |
Disconnected data is the only challenge on that list that’s fully within management’s control to fix.
Why Financial Reports Cannot Predict Future Cash Flow
Financial reports explain history. Cash-flow management requires visibility into what’s about to happen. That distinction is where many businesses get caught off guard.
| What financial reports answer | What cash flow management actually requires |
|---|---|
| “How much revenue did we generate last month?” | “Which customers are about to pay late?” |
| “What was the closing bank balance?” | “What supplier obligations are approaching?” |
| “What’s our current inventory value?” | “Which inventory is aging and consuming cash?” |
| “What were operating expenses?” | “What future commitments are already approved but not yet posted?” |
| “What’s the AR aging?” | “Which collections are critical to next month’s supplier payments?” |
A healthy bank balance today can disguise a significant funding requirement 30 days out. Cash is committed long before cash moves.
This is why 54% of treasury teams report cash forecasting is the single activity they spend the most time on — and why 60% of treasurers still report their forecasts contain significant or major inaccuracies. Effort isn’t the problem. Connected data is.
8 Reasons Cash Flow Forecasts Fail
Nomentia’s analysis of forecast failure modes lines up almost perfectly with what trading businesses experience:
| # | Cause | Why it happens |
|---|---|---|
| 1 | Incomplete / outdated data | Manual collection across systems creates partial snapshots |
| 2 | Human error | Excel miscalculations, wrong cell references |
| 3 | Inadequate information gathering | Subsidiaries, FX rates excluded |
| 4 | No variance analysis | Forecast vs actual never compared; no learning loop |
| 5 | Optimistic assumptions | Assumes on-time customer payment, smooth sales growth |
| 6 | Selective data usage | Intercompany or unplanned expenses excluded |
| 7 | Poor coordination | Treasury, finance siloed; unified forecast impossible |
| 8 | Lack of automation | Manual processes can’t manage global cash-flow complexity |
The 6 Layers of Working Capital Visibility
Most businesses try to improve cash flow by focusing on one area — push collections, reduce inventory, extend supplier terms. Those actions address symptoms. A more sustainable fix is to improve management’s ability to see the whole picture before liquidity tightens.
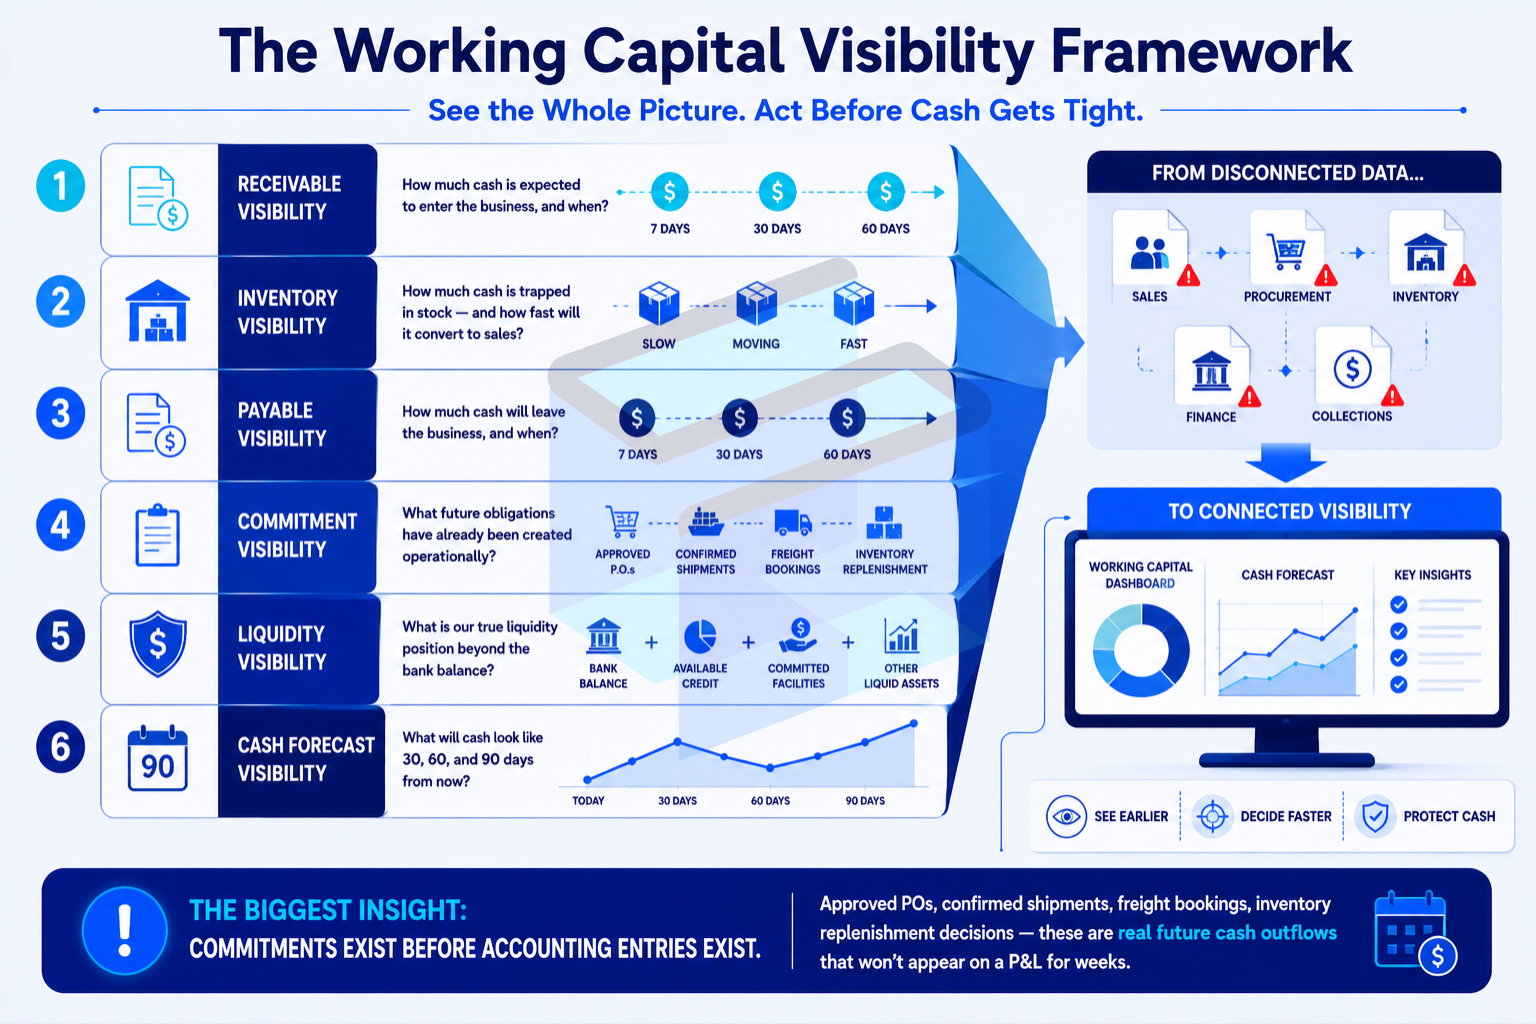
The framework has six visibility layers. When any one is missing, forecasting accuracy collapses.
| # | Layer | Key question it answers |
|---|---|---|
| 1 | Receivable visibility | “How much cash is expected to enter the business, and when?” |
| 2 | Inventory visibility | “How much cash is trapped in stock — and how fast will it convert to sales?” |
| 3 | Payable visibility | “How much cash will leave the business, and when?” |
| 4 | Commitment visibility | “What future obligations have already been created operationally?” |
| 5 | Liquidity visibility | “What is our true liquidity position beyond the bank balance?” |
| 6 | Cash forecast visibility | “What will cash look like 30, 60, and 90 days from now?” |
The single biggest insight from the framework: commitments often exist before accounting entries exist. Approved POs, confirmed shipments, freight bookings, inventory replenishment decisions — these are real future cash outflows that won’t appear on a P&L for weeks. Most cash-flow surprises live in this gap.
How Inventory Carrying Costs Reduce Cash Flow
Inventory is rarely treated as a cash-flow problem — and that’s exactly why it becomes one. Industry benchmarks put annual inventory carrying cost at 15–30% of inventory value (25% is the standard working estimate). Detailed breakdowns by ISDDD show where it goes:
| Carrying cost component | Annual % of inventory value |
|---|---|
| Obsolescence | 6–12% |
| Deterioration / theft | 3–6% |
| Insurance | 1–3% |
| Physical handling | 2–5% |
| Cost of capital, storage, taxes | varies (large in capital-intensive sectors) |
| Range | 22–55% total in some industries |
At 25%, every $1M of inventory costs $250K per year to hold — invisible on the P&L until it shows up as eroded margin, missed supplier discounts, or drawn-down credit lines. Analysis on inventory becoming a cash flow problem puts it directly: inventory arrives ahead of need, sits in the warehouse consuming capital the business doesn’t yet need it to consume.
How ERP creates real-time cash flow visibility
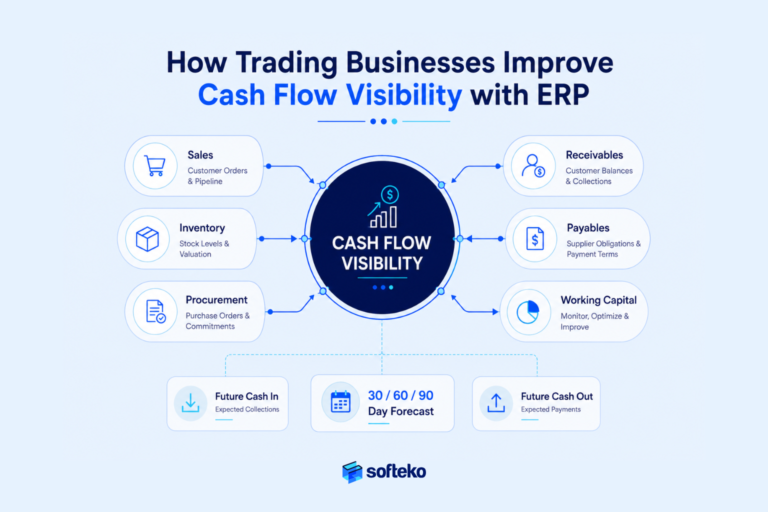
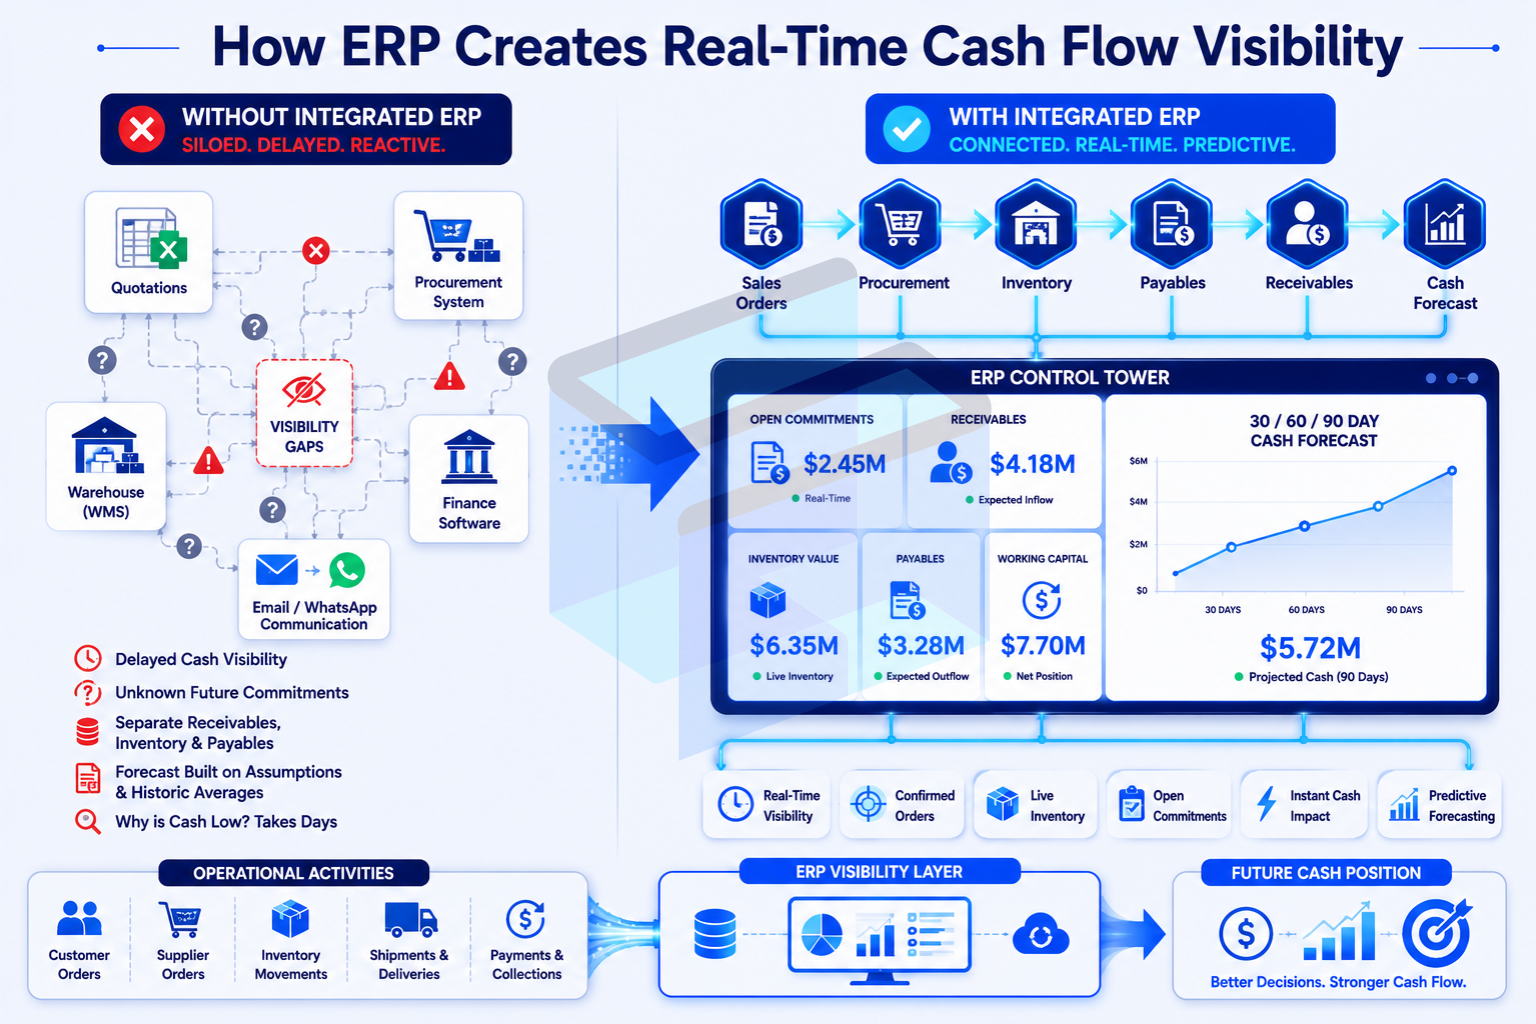
ERP doesn’t improve cash flow because it automates transactions. It improves cash flow because it makes operational activities that drive future liquidity visible in one place.
| Without integrated ERP | With integrated ERP |
|---|---|
| Quotation in spreadsheet, PO in another system, inventory in WMS, collections in finance | All in one connected workflow |
| Cash impact of approved PO visible only after supplier invoice | Open commitments visible immediately |
| Receivables, inventory, payables evaluated separately | All three visible together as working capital |
| Forecast built on assumptions + historic averages | Forecast built on confirmed orders, real commitments, live inventory |
| Cash is a finance-meeting topic | Cash is an operational KPI sales, procurement and warehouse all influence |
| “Why is cash low?” investigation takes a week | “Which operational activities are consuming cash?” answered instantly |
Recent ERP integration analysis frames the value precisely: “Cash flow visibility becomes current rather than historical. When invoice capture feeds validated data directly into ERP as invoices are processed, the liability picture is always current.” And Wipfli’s analysis reinforces why this matters at the leadership level: finance leaders who want real-time visibility, accurate forecasting and strategic influence cannot build those capabilities on disconnected systems.
For trading businesses specifically, the challenge is compounded. Cash management analysis for traders describes the pattern: payments arrive in multiple currencies, regulatory hurdles slow remittances, and the gap between shipping goods and receiving payments stretches working capital thin — leaving even profitable businesses at risk of liquidity traps.
How Odoo supports cash flow visibility
Odoo connects the operational events that create future cash movement. Instead of treating sales, inventory, procurement and finance as separate functions, Odoo allows management to evaluate them as components of a single working-capital system.
| Visibility layer | Odoo capability | Module |
|---|---|---|
| Receivable visibility | Customer balances, credit limits, overdue tracking, payment history, exposure dashboard | Accounting + Sales |
| Inventory visibility | Current stock, reserved stock, aging, multi-warehouse, valuation linked to GL | Inventory + Accounting |
| Payable visibility | Vendor bills, payment schedule, supplier credit terms, FX exposure | Accounting + Purchase |
| Commitment visibility | Open POs, expected supplier invoices, incoming receipts, freight bookings | Purchase + Inventory |
| Liquidity visibility | Consolidated working capital dashboard combining AR + Inventory + AP + commitments | Accounting + Studio |
| Cash forecast visibility | Forecast built from confirmed orders, open POs, scheduled payments, expected collections | Accounting (Cash Flow Forecast) |
The point isn’t the modules. It’s that cash flow becomes operational visibility, not just accounting reporting. Sales sees the cash impact of credit decisions. Procurement sees the cash impact of purchasing decisions. Warehouse sees the cash impact of inventory decisions. Finance sees the consolidated picture in real time instead of reconstructing it from spreadsheets.
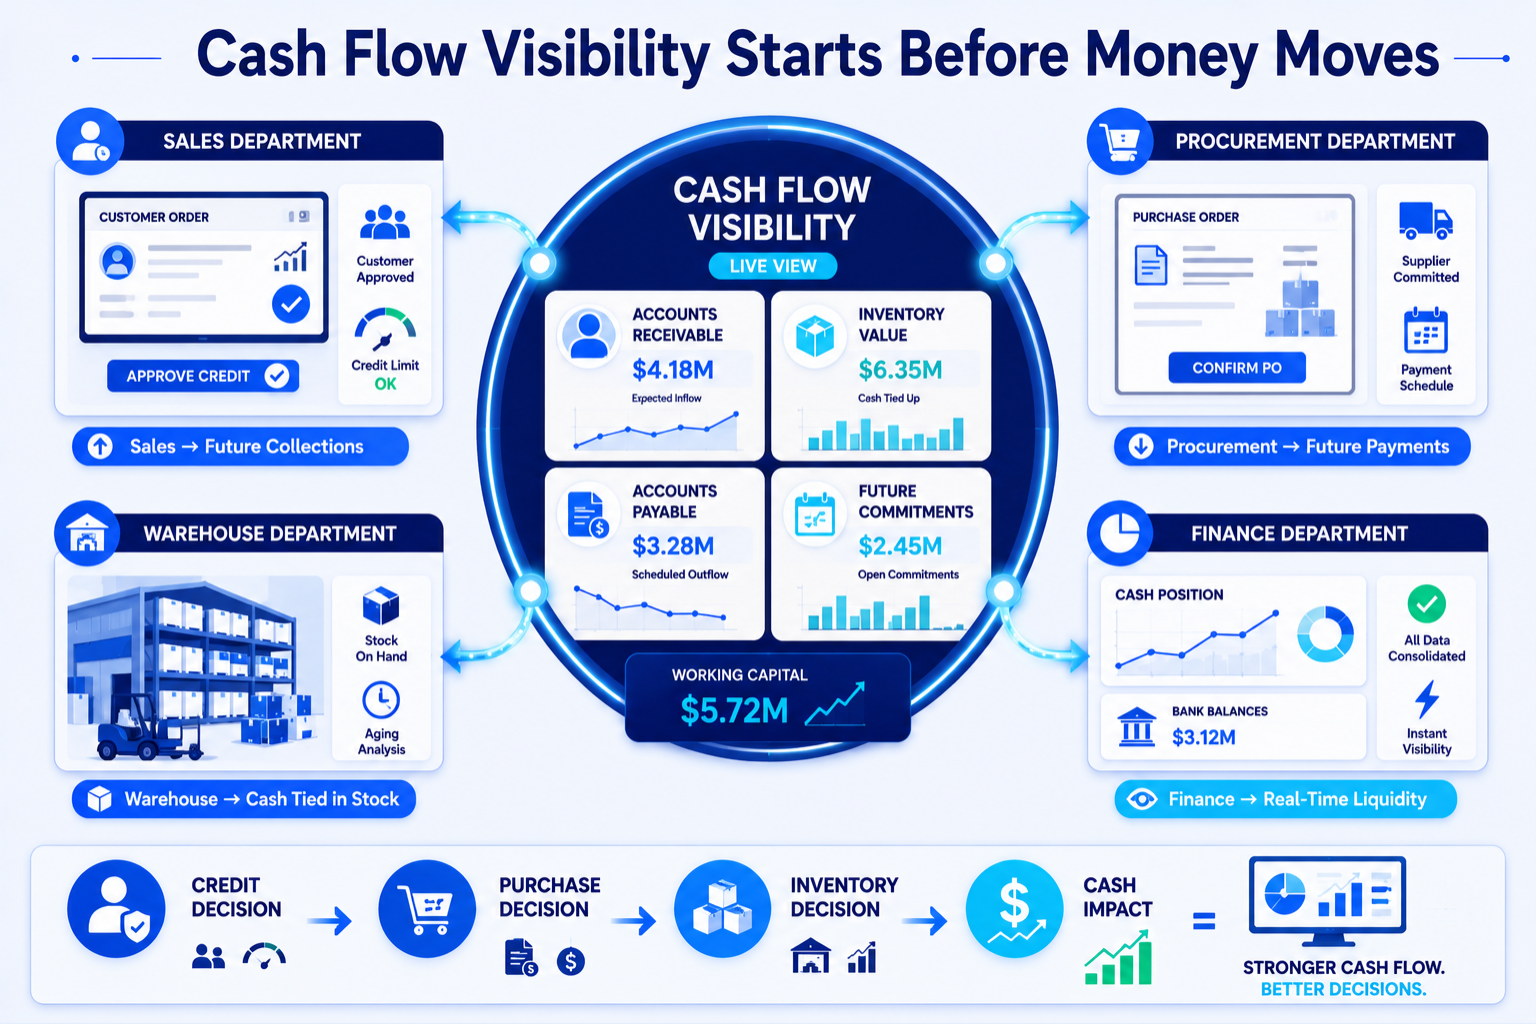
What changes after visibility improves
- Purchasing becomes more disciplined (cash impact visible at approval, not after invoice)
- Inventory investments become easier to justify (carrying cost transparent)
- Customer credit decisions become more controlled
- Forecasts become more reliable (built on operational signals, not assumptions)
- Supplier payment planning becomes proactive
- Emergency borrowing becomes less frequent
Frequently Asked Questions About Cash Flow Visibility
What is cash flow visibility?
The ability to anticipate where cash is going — not just explain where it went. Strong visibility lets management see expected collections, future supplier obligations, inventory exposure, and approved-but-unposted commitments before they hit the bank account.
Why do profitable trading businesses run out of cash?
Because revenue, profit and cash are three different things on three different timelines. As PwC’s 2025/26 data shows, DSO has risen 5.7% and DIO has risen 13.6% over the past decade — meaning cash gets trapped longer in receivables and inventory even when sales are healthy.
What is the Cash Conversion Cycle?
CCC = DIO + DSO − DPO. It measures how long cash invested in inventory takes to return to the business as collected cash. APQC benchmarks put top-quartile performers at ≤33.2 days and bottom-quartile at ≥74 days — a 40+ day gap that directly determines how much working capital you have to finance.
What DSO should a wholesale/distribution business target?
Industry typical is 30–45 days; top quartile is below 28 days (SMB Compass). Anything above 45 days warrants a credit-exposure review.
How much does it cost to carry inventory?
15–30% of inventory value annually (MetricHQ). At a 25% standard rate, $1M of inventory costs $250K per year in carrying cost — covering obsolescence, deterioration, insurance, handling, and cost of capital.
Why do cash forecasts fail?
Six in 10 treasurers say their forecasts contain significant errors (Kyriba via HighRadius). Nomentia’s analysis identifies 8 root causes — almost all related to data fragmentation, manual processes, and lack of variance analysis. Effort isn’t the issue. Connected data is.
Will Odoo automatically improve cash flow?
No system improves cash flow by itself. Odoo improves visibility into the operational decisions driving cash — receivable trends, inventory aging, open commitments, supplier obligations — so management can act before liquidity tightens. The improvement comes from the resulting decisions, not the software.
How is this different from your inventory-and-cash-flow blog?
The Why Inventory Keeps Growing While Cash Flow Gets Worse post focuses specifically on inventory as the root cause. This one focuses on visibility — what to do when inventory is fine but you still can’t see what cash is about to do. Both apply to most trading businesses.
Cash Flow Visibility Self-Assessment Checklist
Before changing anything, answer these honestly about your business right now:
| Question | If “no” → which layer is broken |
|---|---|
| Can you see, in one place, every approved-but-unbilled PO that will require cash in the next 60 days? | Commitment visibility |
| Can finance access the same receivable status that sales sees today? | Receivable visibility |
| Can you tell which inventory was bought against confirmed demand vs forecast? | Inventory visibility |
| Can you forecast cash 90 days out without rebuilding a spreadsheet? | Cash forecast visibility |
| Can you answer “what’s our true liquidity exposure?” in under 5 minutes? | Liquidity visibility |
If three or more answers are “no,” the issue isn’t finance discipline. It’s a visibility-and-system architecture problem.
Improve cash flow visibility before liquidity becomes the issue
If your sales are growing but cash is getting tighter, if forecasts keep missing, if “where’s the cash?” requires a finance investigation rather than a dashboard look — the problem usually isn’t the finance team. It’s the absence of connected visibility across the operational decisions that drive working capital.
At Softeko, we help trading, wholesale, distribution and import-export businesses build Odoo ERP environments that connect Sales, Procurement, Inventory, Operations and Finance into a single working-capital view — so the operational activities that drive future cash become visible in time to act on them.